This paper introduces zenpaths and zenplots to detect and visualize dependence in high-dimensional data, exemplified by S&P 500 constituent data during the 2007-2008 financial crisis. The R package zenplots facilitates these analyses, offering insights into tail dependence and sector-specific model fits.
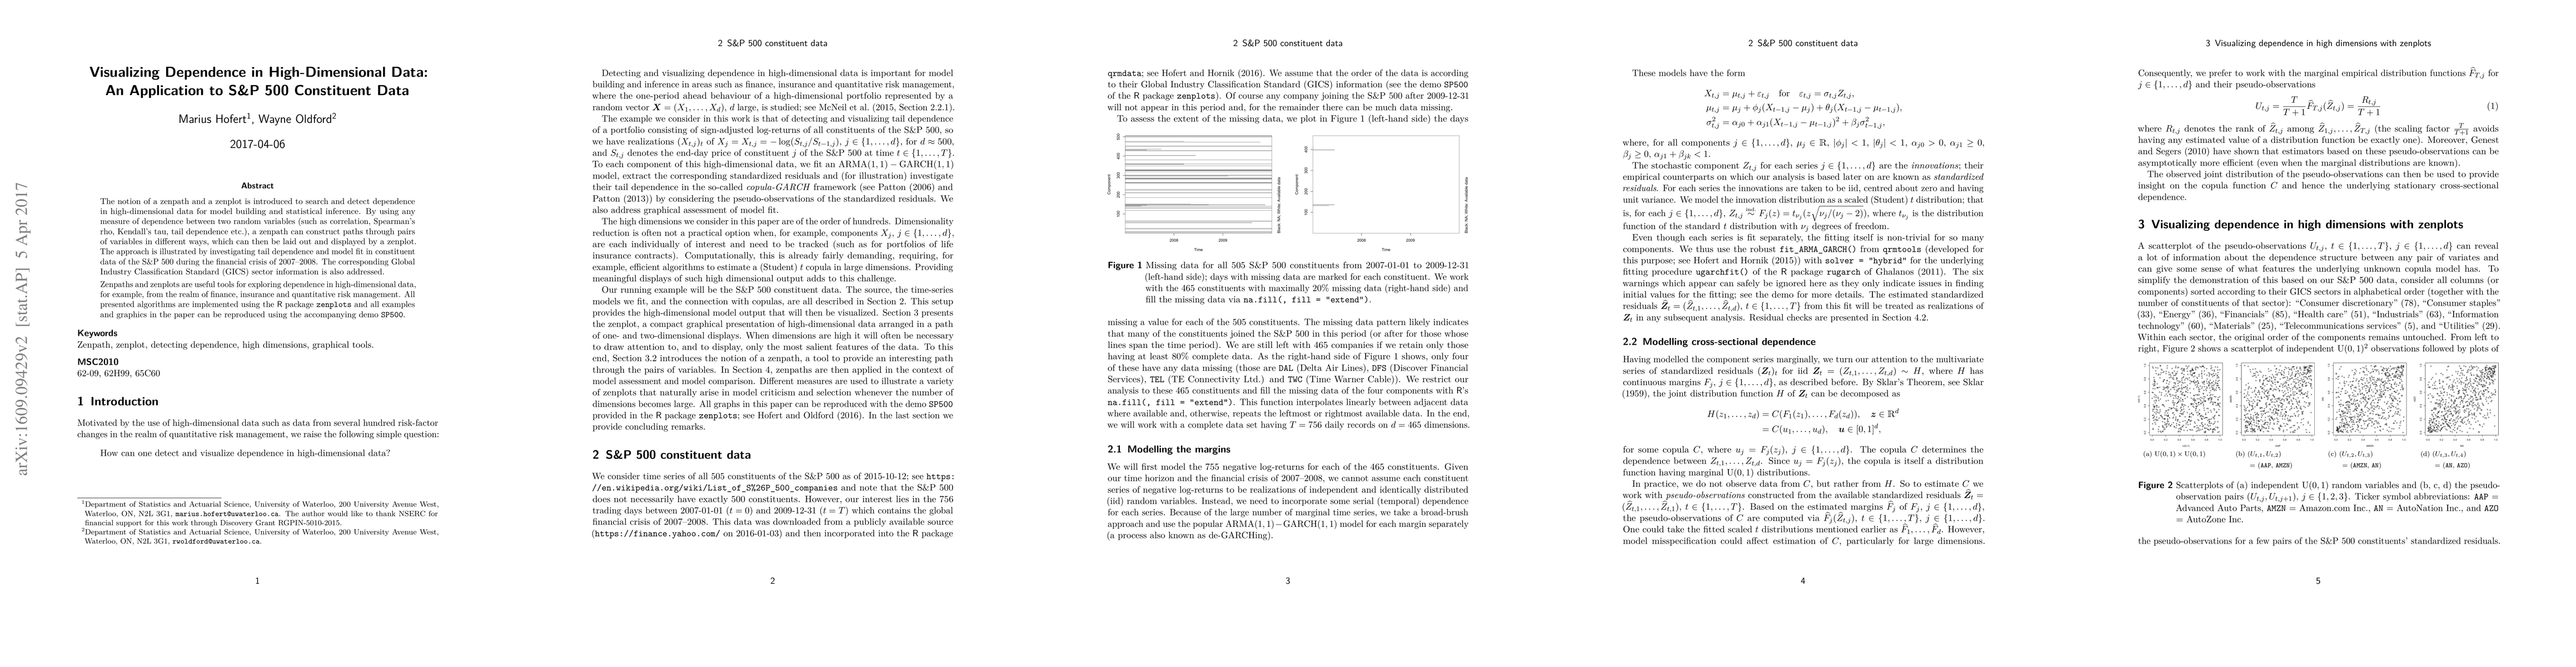
The notion of a zenpath and a zenplot is introduced to search and detect dependence in high-dimensional data for model building and statistical inference. By using any measure of dependence between two random variables (such as correlation, Spearman's rho, Kendall's tau, tail dependence etc.), a zenpath can construct paths through pairs of variables in different ways, which can then be laid out and displayed by a zenplot. The approach is illustrated by investigating tail dependence and model fit in constituent data of the S&P 500 during the financial crisis of 2007-2008. The corresponding Global Industry Classification Standard (GICS) sector information is also addressed. Zenpaths and zenplots are useful tools for exploring dependence in high-dimensional data, for example, from the realm of finance, insurance and quantitative risk management. All presented algorithms are implemented using the R package zenplots and all examples and graphics in the paper can be reproduced using the accompanying demo SP500.
Get AI-generated insights about this paper's methodology, results, and significance.
Current paper (gray), citations (green), references (blue)
Title | Authors | Year | Actions |
---|---|---|---|
Toward the LEO Economy: What is the value of new Commercial Space Stations?
|
Alessandro Paravano, Brendan Rosseau, Giorgio Locatelli, Mathew Weinzierl, Paolo Trucco, Alessandro Paravano
|
2024
|
View Paper |
An Efficient Quasi-Random Sampling for Copulas
|
Sumin Wang, Chenxian Huang, Yongdao Zhou, Min-Qian Liu
|
2024
|
View Paper |
Index-mixed copulas
|
K. Herrmann, M. Hofert, N. Sadr
|
2023
|
View Paper |
The Clique Structure of Johnson Graphs
|
Pavel Shuldiner, R. Oldford
|
2022
|
View Paper |
Assessing the Empirical Linkage Among Access to Finance, Firm Quality, and Firm Performance: New Insight From Bangladeshi SMEs’
|
Mohammad Abir Shahid Chowdhury, Chuanmin Shuai, M. Sokolová, A. Akbar, Z. Ali, Hussain Ali, Md. Zahid Alam
|
2022
|
View Paper |
Dependence Model Assessment and Selection with DecoupleNets
|
M. Hofert, Avinash Prasad, Mu Zhu
|
2022
|
View Paper |
Unveiling the Nexus between Access to Electricity, Firm Size and SME’s Performance in Bangladesh: New Evidence Using PSM
|
Mohammad Abir Shahid Chowdhury, S. Chuanmin, M. Sokolová, Abm Munibur Rahman, A. Akbar, Z. Ali, M. Usman
|
2021
|
View Paper |
Visualizing Variable Importance and Variable Interaction Effects in Machine Learning Models
|
Alan N. Inglis, Andrew C. Parnell, C. Hurley
|
2021
|
View Paper |
Zigzag Expanded Navigation Plots in R: The R Package zenplots
|
M. Hofert, Wayne Oldford
|
2020
|
View Paper |
Multivariate Tail Coefficients: Properties and Estimation
|
I. Gijbels, Vojtech Kika, M. Omelka
|
2020
|
View Paper |
Multivariate time-series modeling with generative neural networks
|
M. Hofert, Avinash Prasad, Mu Zhu
|
2020
|
View Paper |
A framework for measuring association of random vectors via collapsed random variables
|
M. Hofert, Wayne Oldford, Avinash Prasad, Mu Zhu
|
2019
|
View Paper |
Asymptotic independence and support detection techniques for heavy-tailed multivariate data
|
Jaakko Lehtomaa, S. Resnick
|
2019
|
View Paper |
Quasi-Random Sampling for Multivariate Distributions via Generative Neural Networks
|
M. Hofert, Avinash Prasad, Mu Zhu
|
2018
|
View Paper |
Special issue on risk management
|
J. Maheu, Marc S. Paolella, T. Siu, Mike K. P. So
|
2018
|
View Paper |
A framework for measuring dependence between random vectors
|
M. Hofert, Wayne Oldford, Avinash Prasad, Mu Zhu
|
2018
|
View Paper |
Graphical Diagnostics, Tests, and Model Selection
|
M. Hofert, I. Kojadinovic, M. Mächler, Jun Yan
|
2018
|
View Paper |
Copula–based clustering methods
|
F. Marta L. Di Lascio, F. Durante, R. Pappadà
|
2017
|
View Paper |
Comments (0)