Visualizing the Finer Cluster Structure of Large-Scale and High-Dimensional Data
Publication
Metrics
AI Quick Summary
This paper proposes a generalized sigmoid function to model distance similarity in high-dimensional data, introducing a parameter b to adjust the function's tail heaviness for better visualization. The method is shown to generate results comparable to UMAP, with the ability to reveal finer cluster structures or maintain neighborhood continuity by adjusting b.
Paper Preview
Abstract
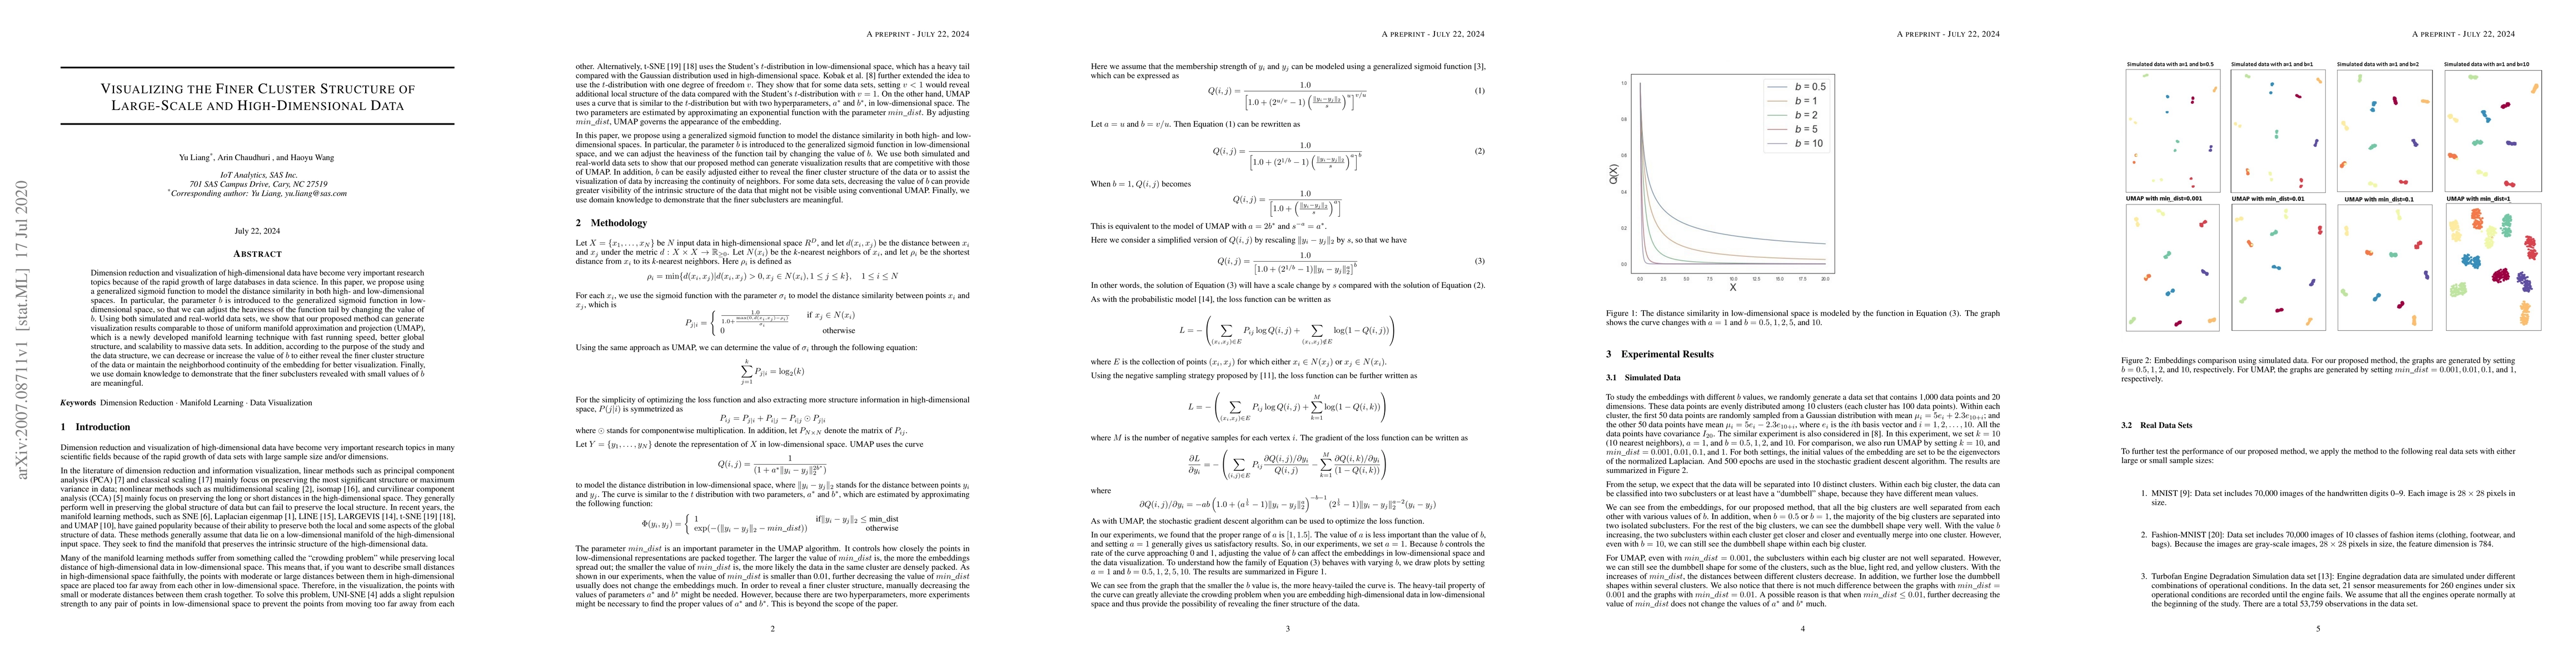
Dimension reduction and visualization of high-dimensional data have become very important research topics because of the rapid growth of large databases in data science. In this paper, we propose using a generalized sigmoid function to model the distance similarity in both high- and low-dimensional spaces. In particular, the parameter b is introduced to the generalized sigmoid function in low-dimensional space, so that we can adjust the heaviness of the function tail by changing the value of b. Using both simulated and real-world data sets, we show that our proposed method can generate visualization results comparable to those of uniform manifold approximation and projection (UMAP), which is a newly developed manifold learning technique with fast running speed, better global structure, and scalability to massive data sets. In addition, according to the purpose of the study and the data structure, we can decrease or increase the value of b to either reveal the finer cluster structure of the data or maintain the neighborhood continuity of the embedding for better visualization. Finally, we use domain knowledge to demonstrate that the finer subclusters revealed with small values of b are meaningful.
AI Key Findings
Get AI-generated insights about this paper's methodology, results, significance, and more — seven facets brought into focus.
Impact
Paper Details
Authors
PDF Preview
Key Terms
Citation Network
Current paper (gray), citations (green), references (blue)
Display is limited for performance on very large graphs.
Discussion 0