Publication
Metrics
Paper Preview
Abstract
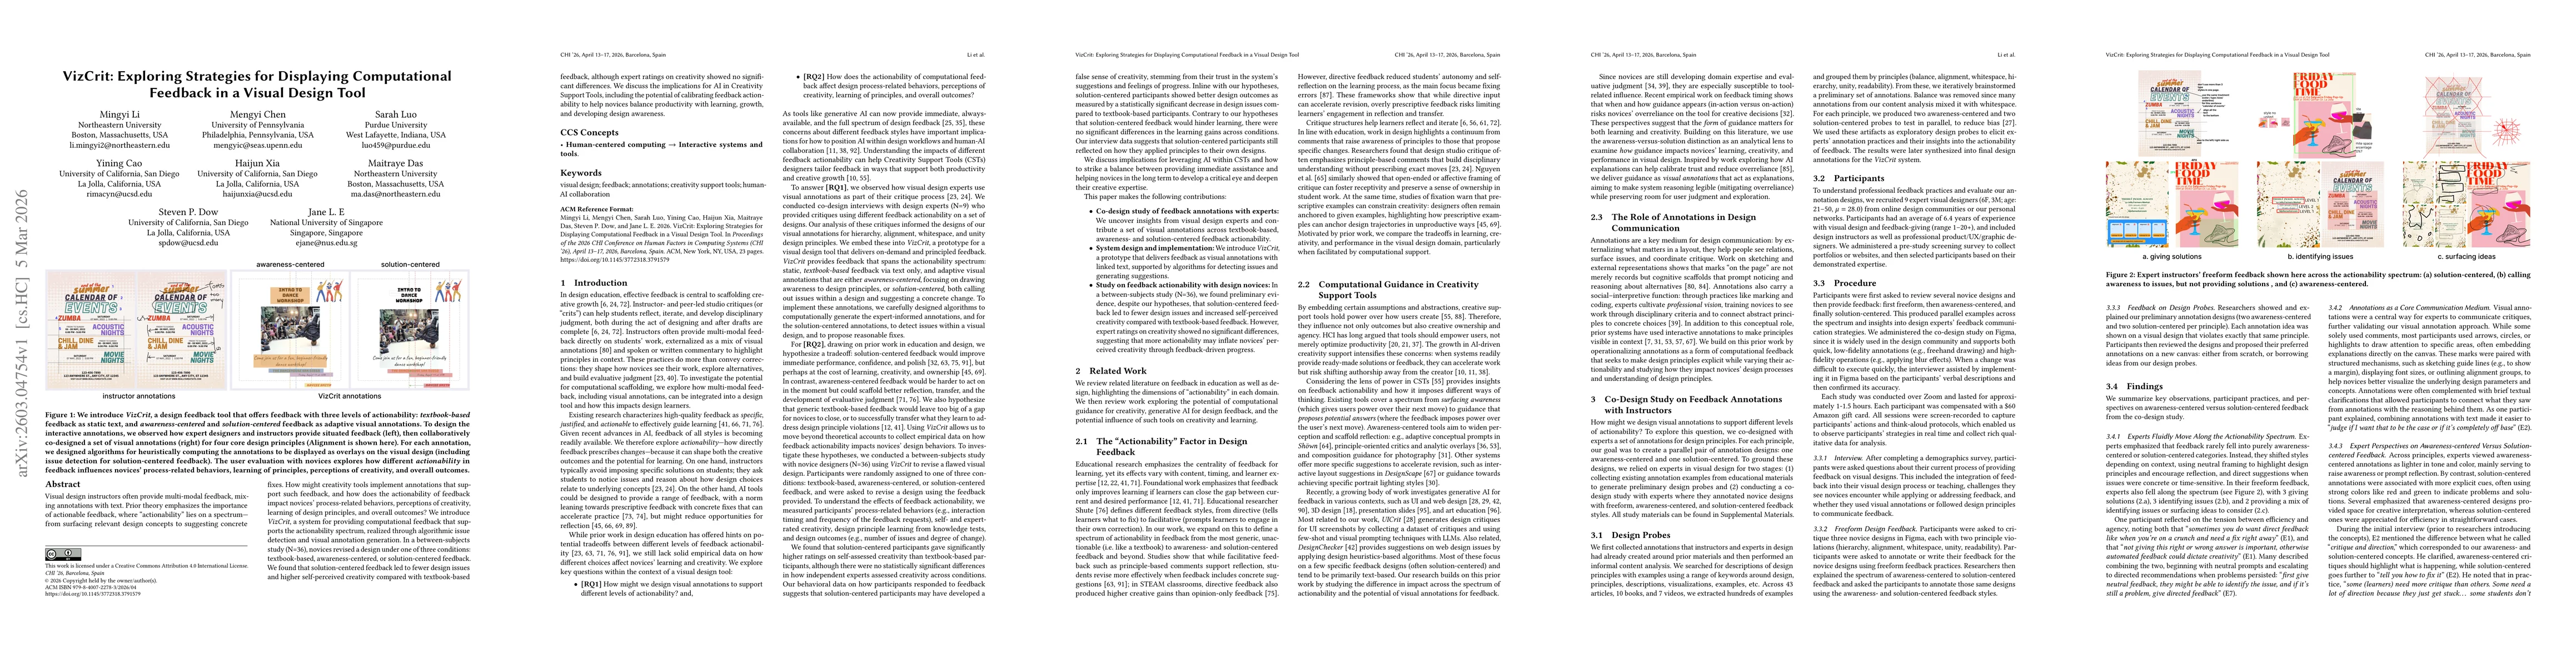
Visual design instructors often provide multi-modal feedback, mixing annotations with text. Prior theory emphasizes the importance of actionable feedback, where "actionability" lies on a spectrum--from surfacing relevant design concepts to suggesting concrete fixes. How might creativity tools implement annotations that support such feedback, and how does the actionability of feedback impact novices' process-related behaviors, perceptions of creativity, learning of design principles, and overall outcomes? We introduce VizCrit, a system for providing computational feedback that supports the actionability spectrum, realized through algorithmic issue detection and visual annotation generation. In a between-subjects study (N=36), novices revised a design under one of three conditions: textbook-based, awareness-centered, or solution-centered feedback. We found that solution-centered feedback led to fewer design issues and higher self-perceived creativity compared with textbook-based feedback, although expert ratings on creativity showed no significant differences. We discuss the implications for AI in Creativity Support Tools, including the potential of calibrating feedback actionability to help novices balance productivity with learning, growth, and developing design awareness.
AI Key Findings
Get AI-generated insights about this paper's methodology, results, significance, and more — seven facets brought into focus.
Discussion 0