Volume-Centred Range Bars: Novel Interpretable Representation of Financial Markets Designed for Machine Learning Applications
Publication
Metrics
AI Quick Summary
Researchers developed a new market representation using volume-price data to improve machine learning performance in financial markets, showing it can lead to better classification of time series patterns and reliable feature interactions.
Paper Preview
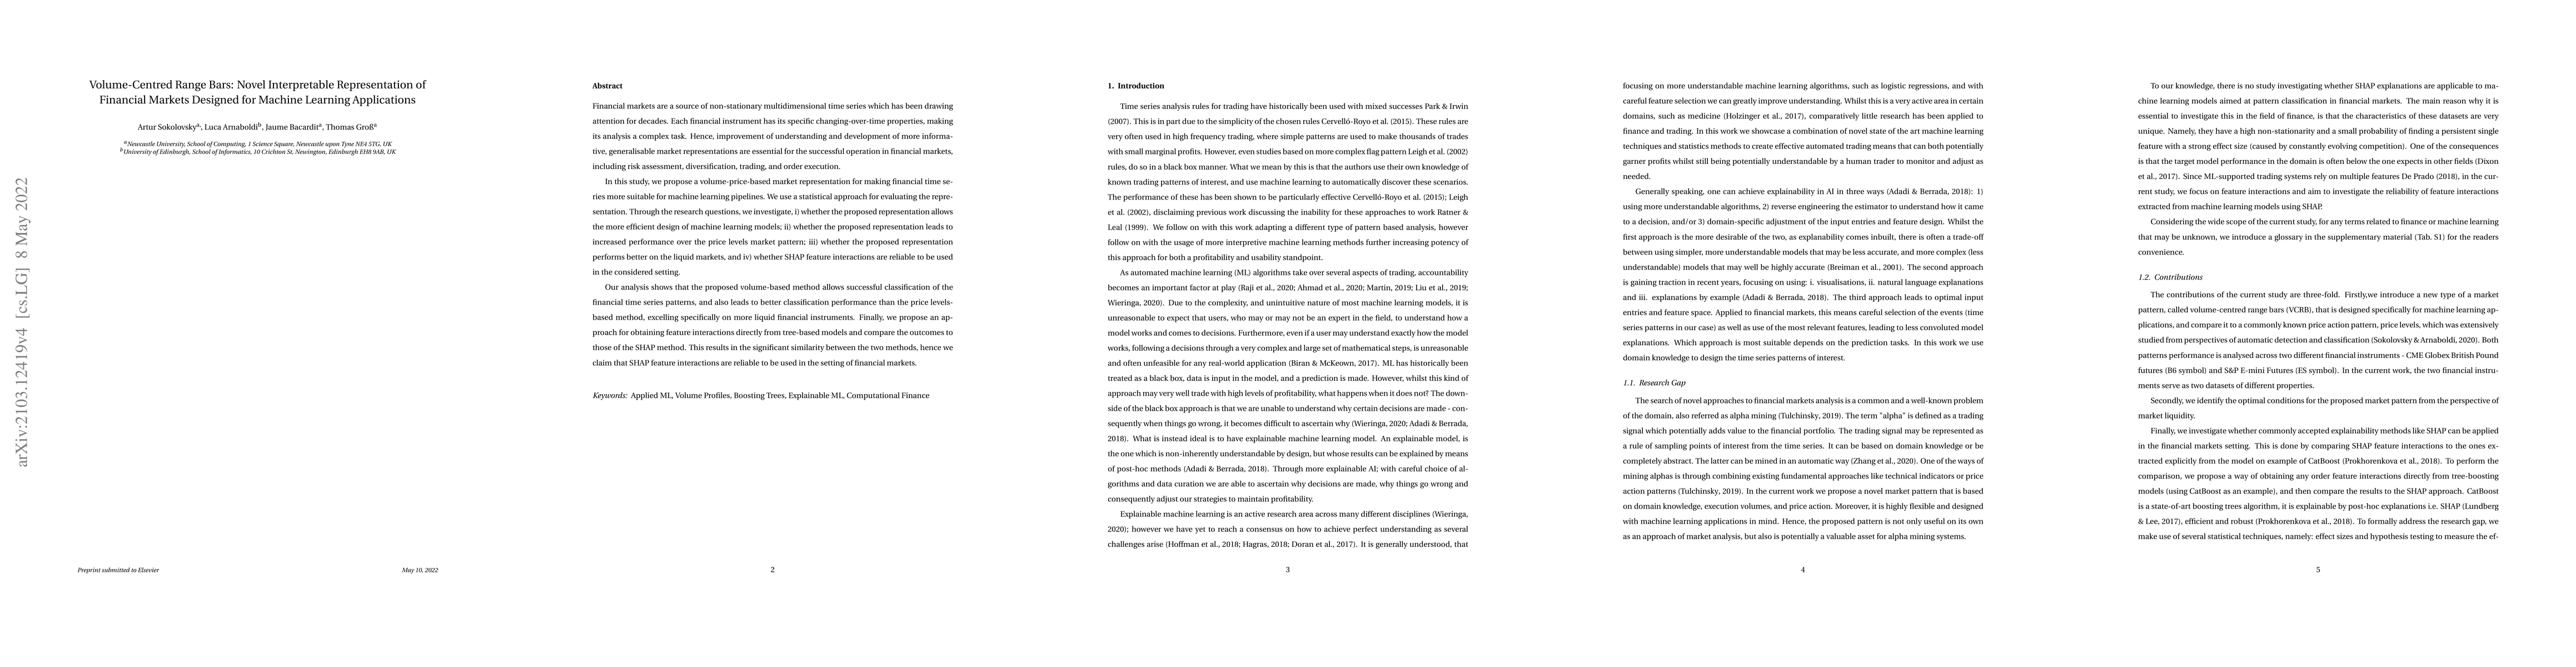
Abstract
Financial markets are a source of non-stationary multidimensional time series which has been drawing attention for decades. Each financial instrument has its specific changing-over-time properties, making its analysis a complex task. Hence, improvement of understanding and development of more informative, generalisable market representations are essential for the successful operation in financial markets, including risk assessment, diversification, trading, and order execution. In this study, we propose a volume-price-based market representation for making financial time series more suitable for machine learning pipelines. We use a statistical approach for evaluating the representation. Through the research questions, we investigate, i) whether the proposed representation allows the more efficient design of machine learning models; ii) whether the proposed representation leads to increased performance over the price levels market pattern; iii) whether the proposed representation performs better on the liquid markets, and iv) whether SHAP feature interactions are reliable to be used in the considered setting. Our analysis shows that the proposed volume-based method allows successful classification of the financial time series patterns, and also leads to better classification performance than the price levels-based method, excelling specifically on more liquid financial instruments. Finally, we propose an approach for obtaining feature interactions directly from tree-based models and compare the outcomes to those of the SHAP method. This results in the significant similarity between the two methods, hence we claim that SHAP feature interactions are reliable to be used in the setting of financial markets.
AI Key Findings
Get AI-generated insights about this paper's methodology, results, significance, and more — seven facets brought into focus.
Impact
Paper Details
Authors
PDF Preview
Key Terms
Citation Network
Current paper (gray), citations (green), references (blue)
Display is limited for performance on very large graphs.
Discussion 0