Who benefits from Visualization Adaptations? Towards a better Understanding of the Influence of Visualization Literacy
Publication
Metrics
AI Quick Summary
This study investigates how visualization literacy (VL) influences the benefits of visualization adaptations, finding that a De-Emphasis adaptation improves performance across all users, but particularly affects task completion time for bar charts based on users' VL levels. The research highlights the complex relationship between VL and visual adaptations.
Paper Preview
Abstract
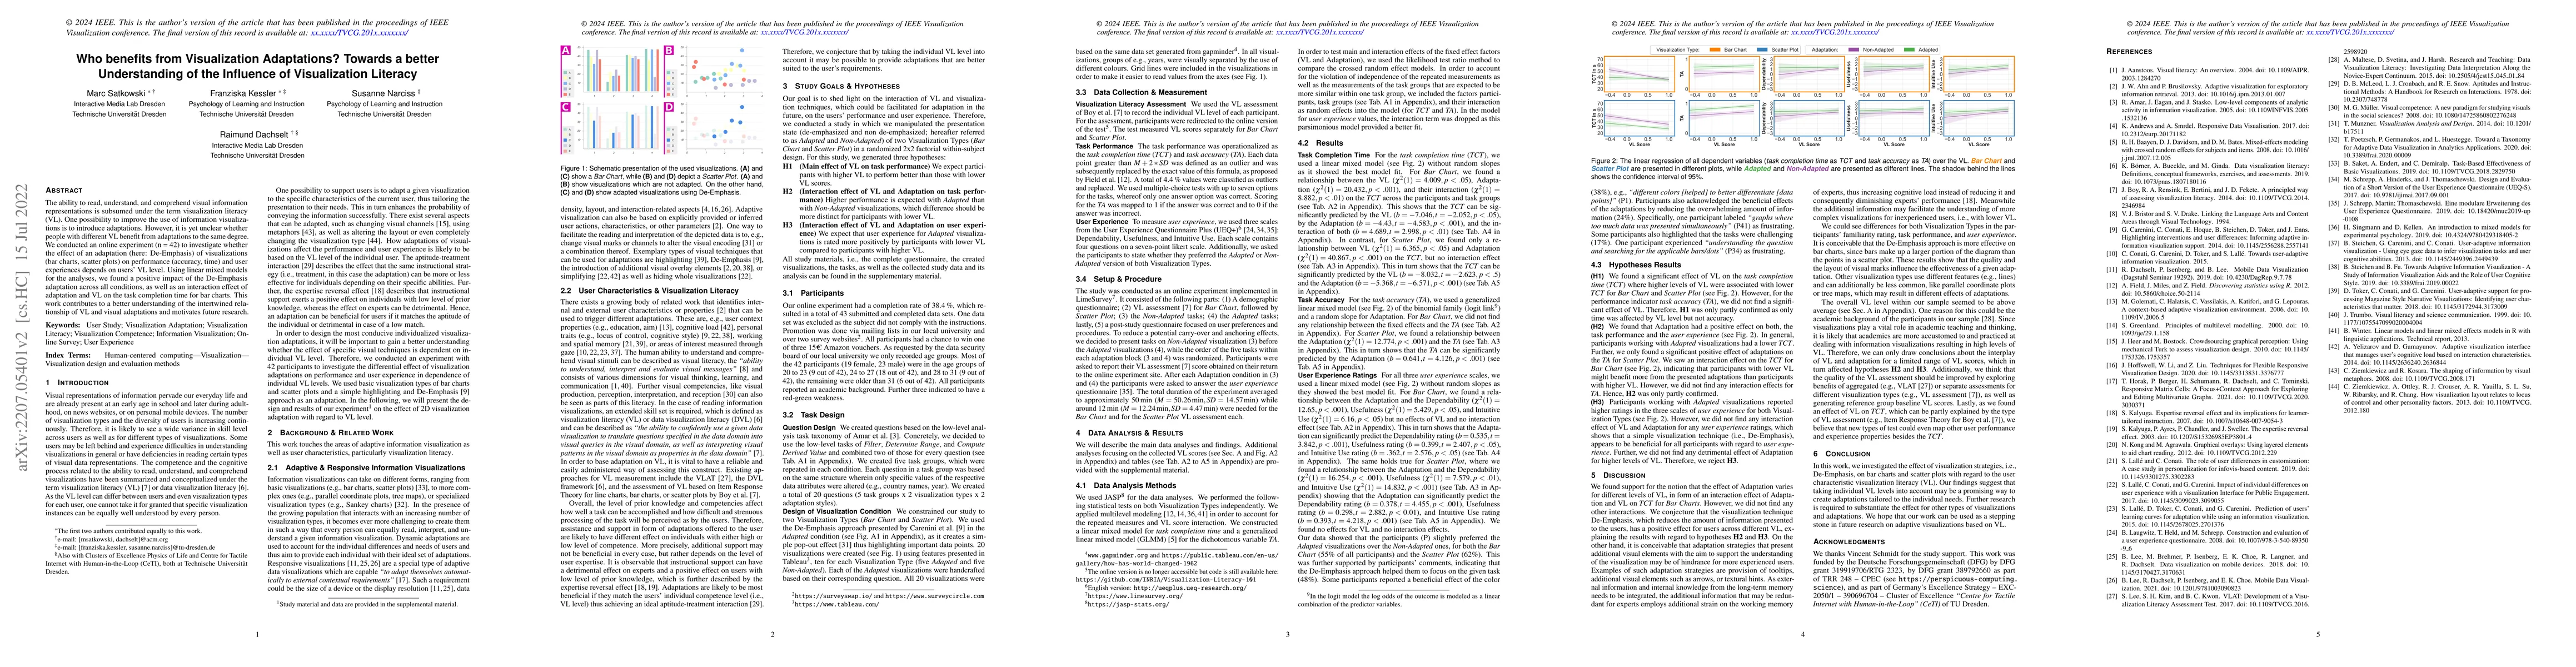
The ability to read, understand, and comprehend visual information representations is subsumed under the term visualization literacy (VL). One possibility to improve the use of information visualizations is to introduce adaptations. However, it is yet unclear whether people with different VL benefit from adaptations to the same degree. We conducted an online experiment (n = 42) to investigate whether the effect of an adaptation (here: De-Emphasis) of visualizations (bar charts, scatter plots) on performance (accuracy, time) and user experiences depends on users' VL level. Using linear mixed models for the analyses, we found a positive impact of the De-Emphasis adaptation across all conditions, as well as an interaction effect of adaptation and VL on the task completion time for bar charts. This work contributes to a better understanding of the intertwined relationship of VL and visual adaptations and motivates future research.
AI Key Findings
Get AI-generated insights about this paper's methodology, results, significance, and more — seven facets brought into focus.
Impact
Paper Details
Authors
PDF Preview
Key Terms
Citation Network
Current paper (gray), citations (green), references (blue)
Display is limited for performance on very large graphs.
Discussion 0