Publication
Metrics
AI Quick Summary
This paper investigates the distribution of share prices and three financial indicators using data from 8,000 global companies (2004-2013), finding that both follow Zipf's law, a power law distribution with an exponent of 1. The study concludes that share prices follow this law because company fundamentals, represented by dividends, cash flow, and book value per share, also exhibit similar distribution characteristics.
Paper Preview
Abstract
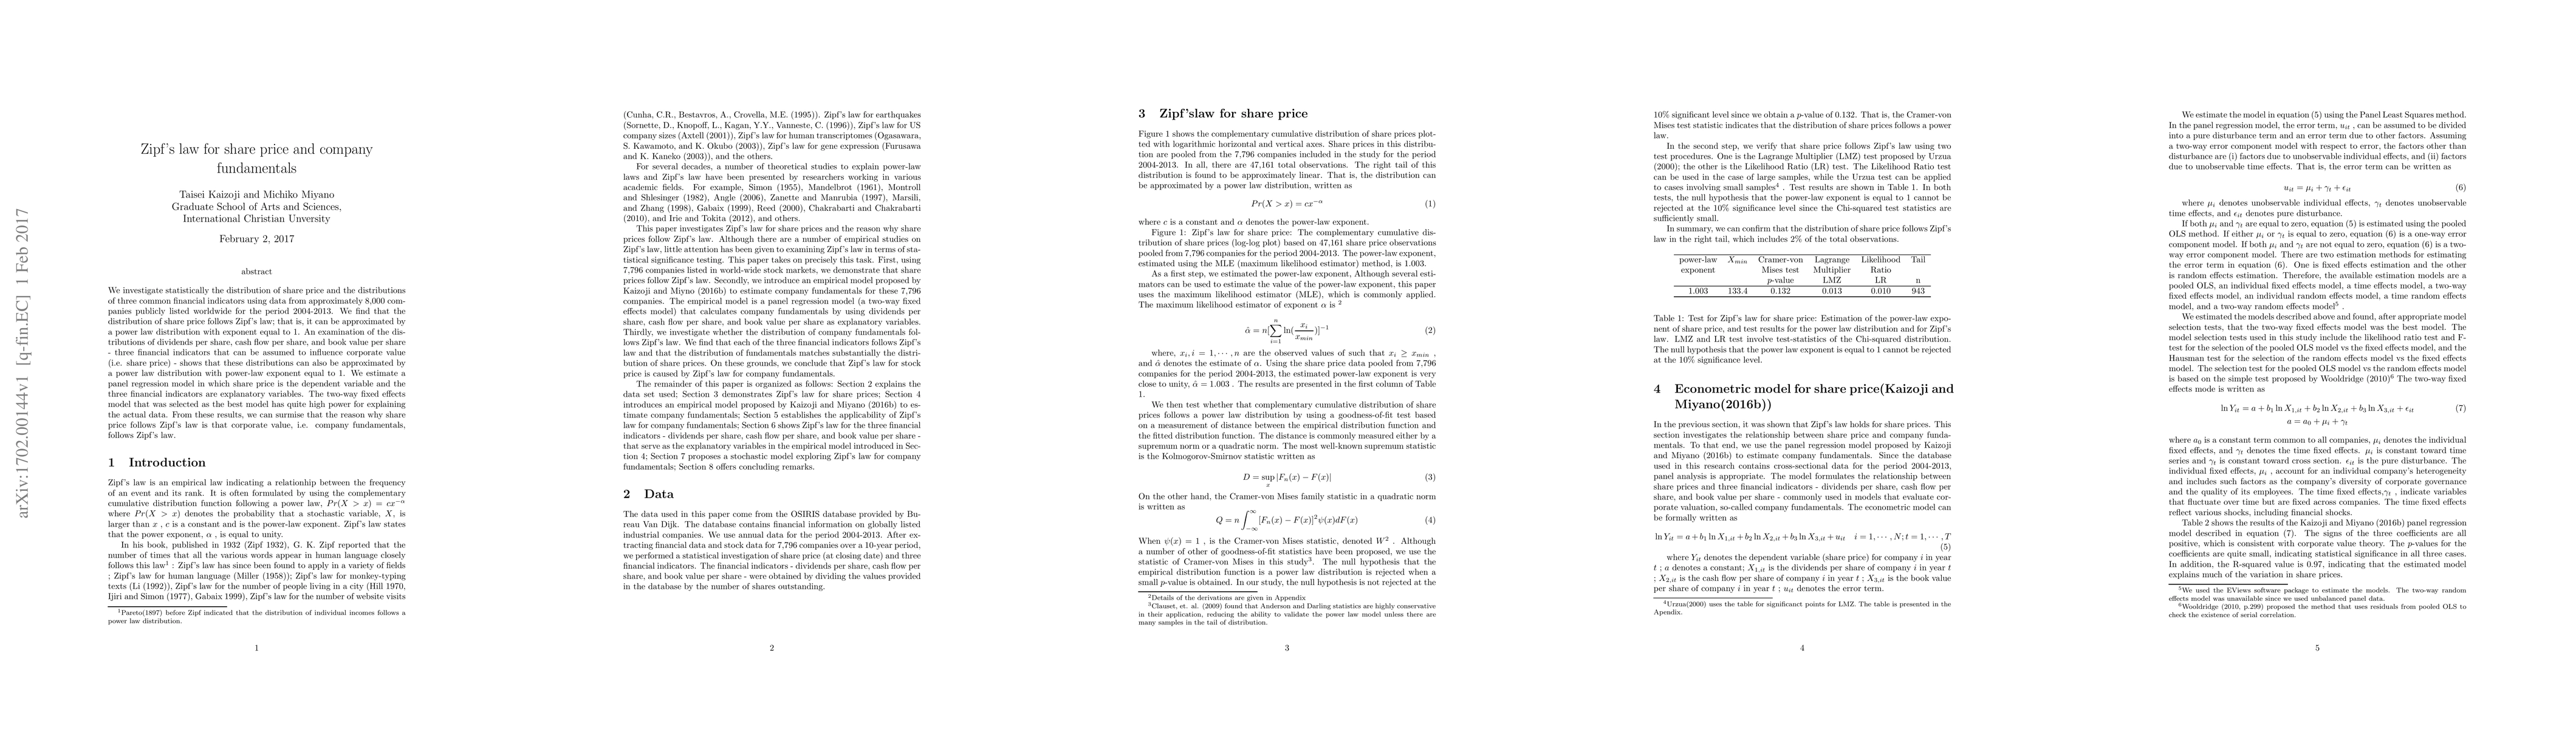
We statistically investigate the distribution of share price and the distributions of three common financial indicators using data from approximately 8,000 companies publicly listed worldwide for the period 2004-2013. We find that the distribution of share price follows Zipf's law; that is, it can be approximated by a power law distribution with exponent equal to 1. An examination of the distributions of dividends per share, cash flow per share, and book value per share - three financial indicators that can be assumed to influence corporate value (i.e. share price) - shows that these distributions can also be approximated by a power law distribution with power-law exponent equal to 1. We estimate a panel regression model in which share price is the dependent variable and the three financial indicators are explanatory variables. The two-way fixed effects model that was selected as the best model has quite high power for explaining the actual data. From these results, we can surmise that the reason why share price follows Zipf's law is that corporate value, i.e. company fundamentals, follows Zipf's law.
AI Key Findings
Get AI-generated insights about this paper's methodology, results, significance, and more — seven facets brought into focus.
Impact
Paper Details
PDF Preview
Key Terms
Citation Network
Current paper (gray), citations (green), references (blue)
Display is limited for performance on very large graphs.
Discussion 0