Publication
Metrics
Paper Preview
Abstract
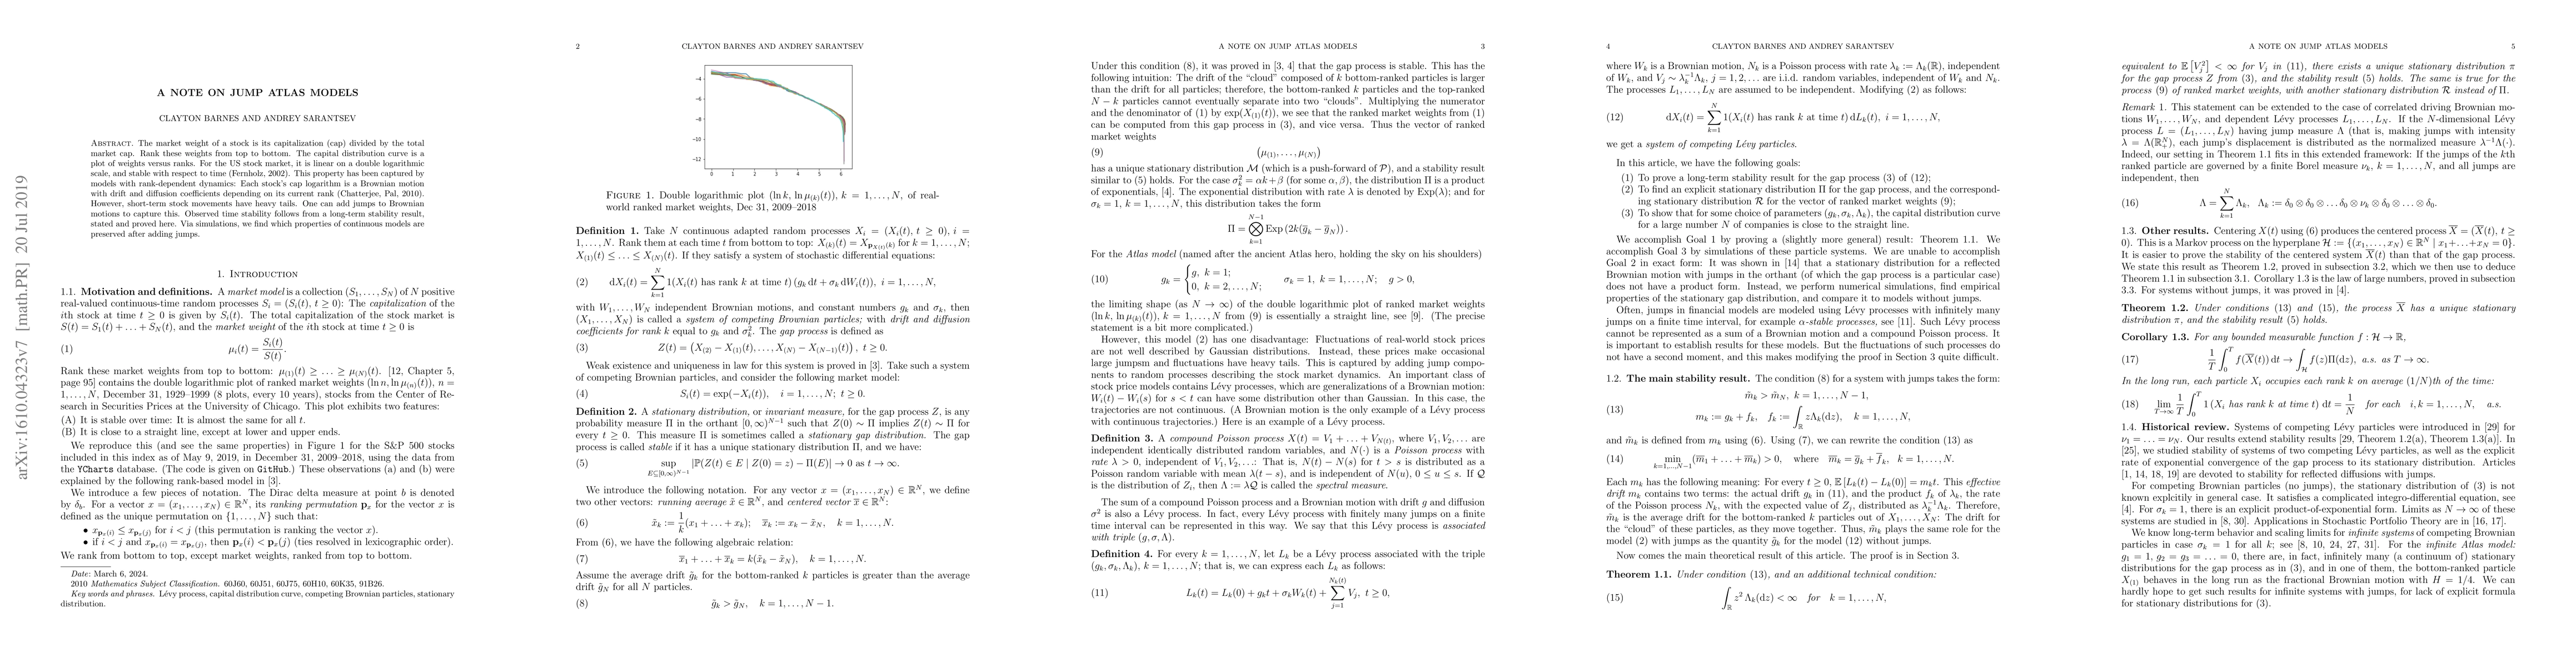
The market weight of a stock is its capitalization (cap) divided by the total market cap. Rank these weights from top to bottom. The capital distribution curve is a plot of weights versus ranks. For the US stock market, it is linear on a double logarithmic scale, and stable with respect to time (Fernholz, 2002). This property has been captured by models with rank-dependent dynamics: Each stock's cap logarithm is a Brownian motion with drift and diffusion coefficients depending on its current rank (Chatterjee, Pal, 2010). However, short-term stock movements have heavy tails. One can add jumps to Brownian motions to capture this. Observed time stability follows from a long-term stability result, stated and proved here. Via simulations, we find which properties of continuous models are preserved after adding jumps.
AI Key Findings
Get AI-generated insights about this paper's methodology, results, significance, and more — seven facets brought into focus.
Impact
Paper Details
PDF Preview
Key Terms
Citation Network
Current paper (gray), citations (green), references (blue)
Display is limited for performance on very large graphs.
Discussion 0