A Visual Analytics Based Decision Making Environment for COVID-19 Modeling and Visualization
Publication
Metrics
AI Quick Summary
The tool enables users to analyze different scenarios, drill-down to detailed statistics, and understand the impact of their decisions.
Paper Preview
Abstract
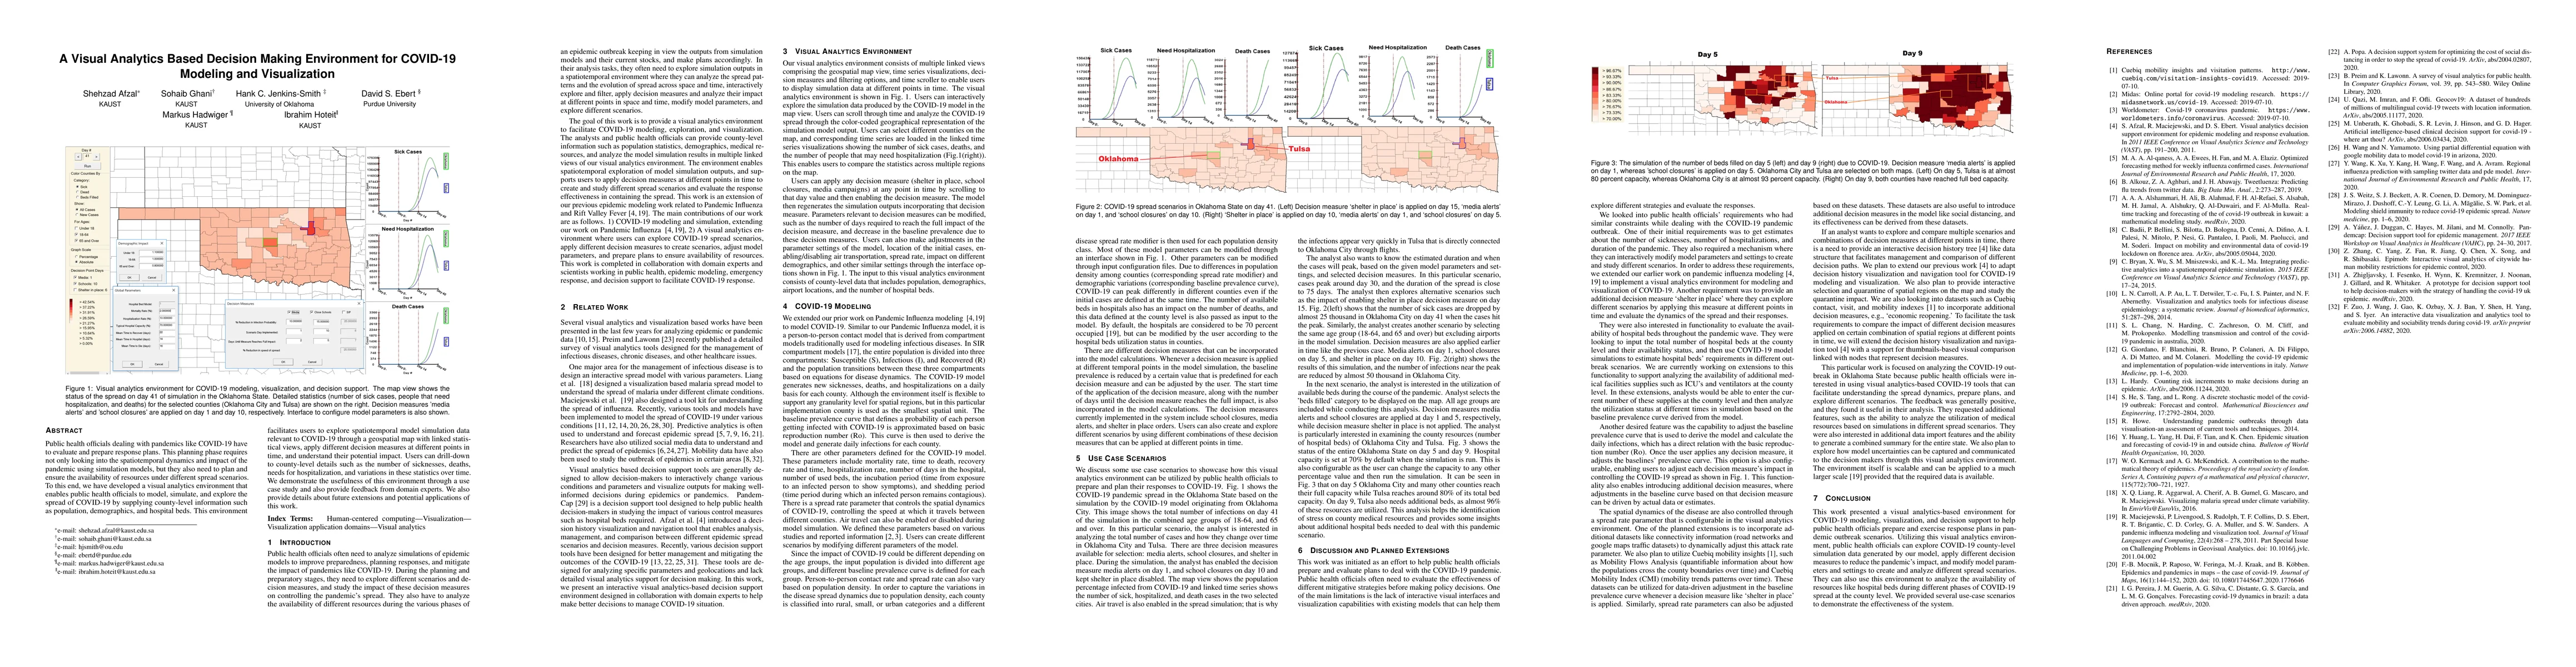
Public health officials dealing with pandemics like COVID-19 have to evaluate and prepare response plans. This planning phase requires not only looking into the spatiotemporal dynamics and impact of the pandemic using simulation models, but they also need to plan and ensure the availability of resources under different spread scenarios. To this end, we have developed a visual analytics environment that enables public health officials to model, simulate, and explore the spread of COVID-19 by supplying county-level information such as population, demographics, and hospital beds. This environment facilitates users to explore spatiotemporal model simulation data relevant to COVID-19 through a geospatial map with linked statistical views, apply different decision measures at different points in time, and understand their potential impact. Users can drill-down to county-level details such as the number of sicknesses, deaths, needs for hospitalization, and variations in these statistics over time. We demonstrate the usefulness of this environment through a use case study and also provide feedback from domain experts. We also provide details about future extensions and potential applications of this work.
AI Key Findings
Get AI-generated insights about this paper's methodology, results, significance, and more — seven facets brought into focus.
Impact
Paper Details
Authors
PDF Preview
Key Terms
Citation Network
Current paper (gray), citations (green), references (blue)
Display is limited for performance on very large graphs.
Discussion 0