An Empirical Study of Counterfactual Visualization to Support Visual Causal Inference
Publication
Metrics
AI Quick Summary
This paper investigates how counterfactual visualizations can enhance users' understanding of causal relationships in data. The study found that participants had better interpretations of causal relations when counterfactual scenarios were visualized, suggesting a promising direction for integrating counterfactuals into data communication.
Paper Preview
Abstract
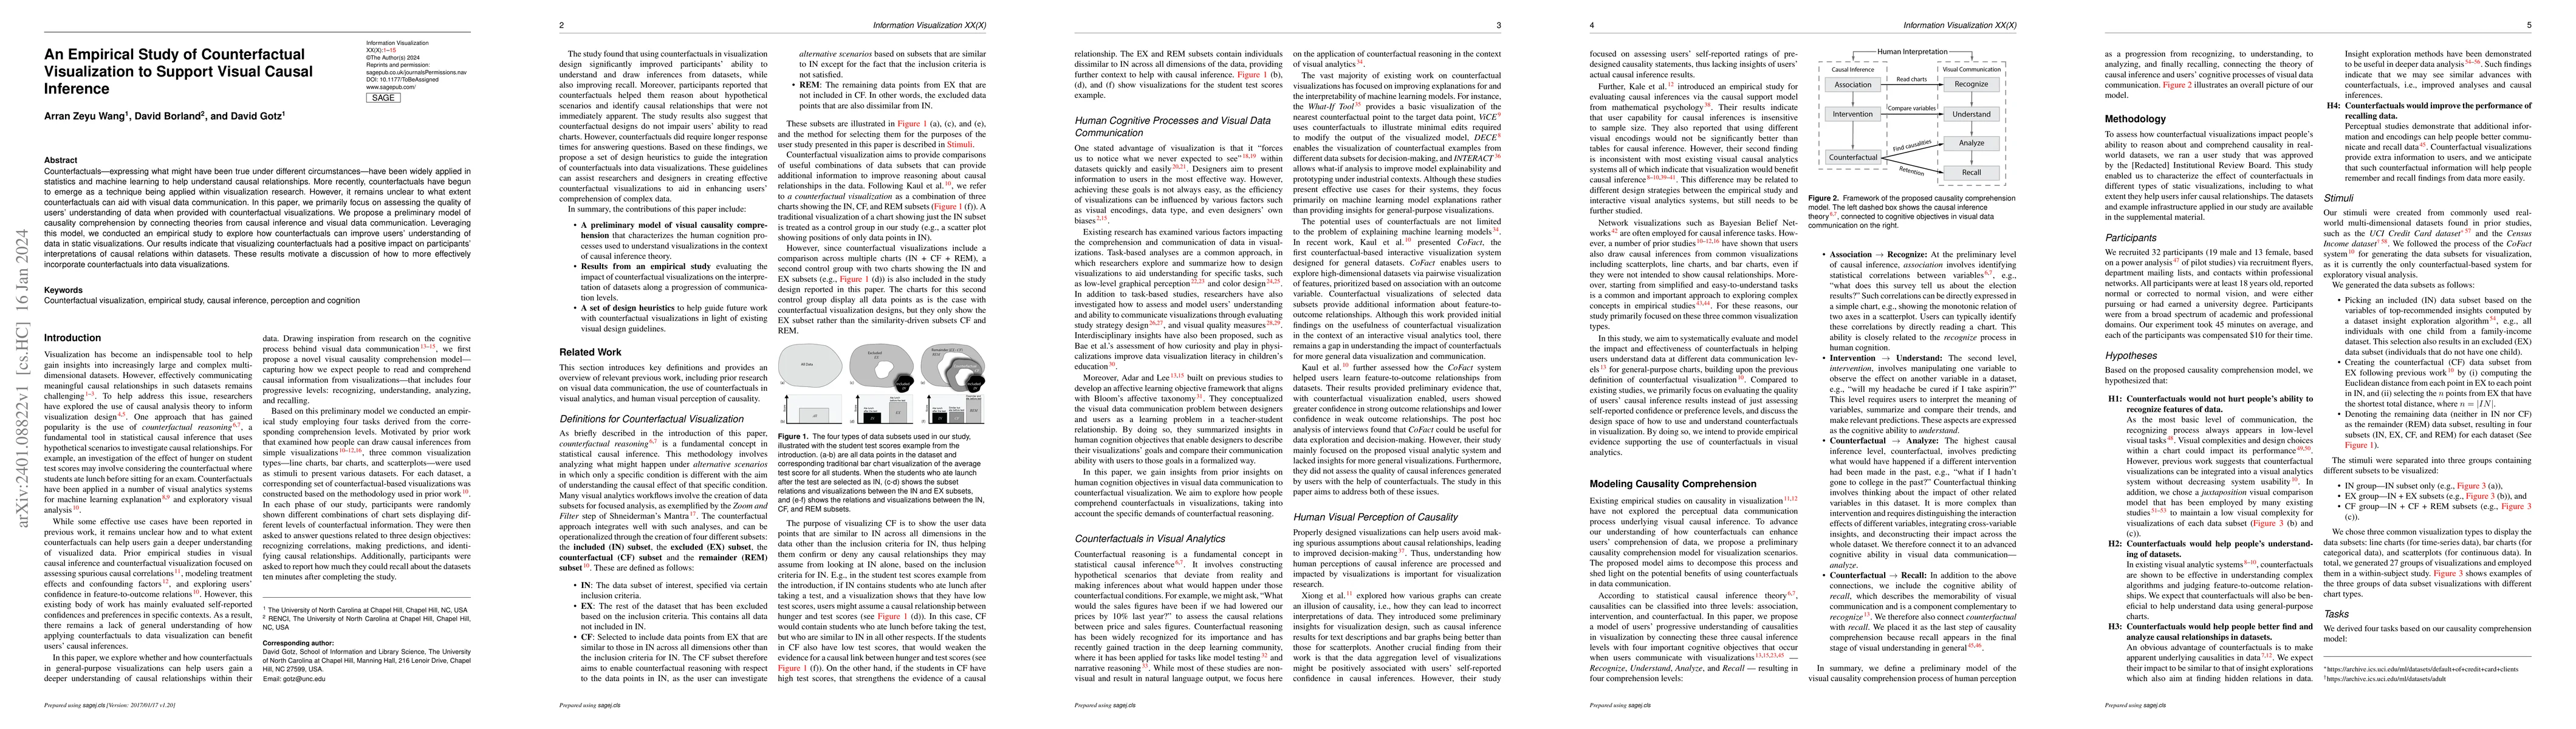
Counterfactuals -- expressing what might have been true under different circumstances -- have been widely applied in statistics and machine learning to help understand causal relationships. More recently, counterfactuals have begun to emerge as a technique being applied within visualization research. However, it remains unclear to what extent counterfactuals can aid with visual data communication. In this paper, we primarily focus on assessing the quality of users' understanding of data when provided with counterfactual visualizations. We propose a preliminary model of causality comprehension by connecting theories from causal inference and visual data communication. Leveraging this model, we conducted an empirical study to explore how counterfactuals can improve users' understanding of data in static visualizations. Our results indicate that visualizing counterfactuals had a positive impact on participants' interpretations of causal relations within datasets. These results motivate a discussion of how to more effectively incorporate counterfactuals into data visualizations.
AI Key Findings
Get AI-generated insights about this paper's methodology, results, significance, and more — seven facets brought into focus.
Impact
Paper Details
Authors
PDF Preview
Key Terms
Citation Network
Current paper (gray), citations (green), references (blue)
Display is limited for performance on very large graphs.
Discussion 0