Publication

Published: May 25, 2025
Categories: cs.CL

Metrics

Source: ArXiv

Quick Actions

View PDF

AI Quick Summary

ChartLens improves fine-grained chart attribution by 26-66% through segmentation-based techniques and set-of-marks prompting with MLLMs.

Quick Answers

What is "ChartLens: Fine-grained Visual Attribution in Charts" about?

ChartLens improves fine-grained chart attribution by 26-66% through segmentation-based techniques and set-of-marks prompting with MLLMs.

What methodology did the authors use?

The research introduces ChartLens, a novel chart attribution algorithm that uses segmentation-based techniques to identify chart objects and employs set-of-marks prompting with multimodal large language models (MLLMs) for fine-grained visual attribution. More in Methodology →

What are the key results?

ChartLens improves fine-grained attributions by 26-66% as shown in evaluations. — The paper presents ChartVA-Eval, a benchmark with synthetic and real-world charts from diverse domains like finance, policy, and economics, featuring fine-grained attribution annotations. More in Key Results →

Why is this work significant?

This research is important as it tackles the hallucination problem in MLLMs when dealing with chart understanding, thereby enhancing the reliability of generated text sequences concerning provided visual data. More in Significance →

What are the main limitations?

The paper does not discuss potential limitations or challenges encountered in developing ChartLens or creating the ChartVA-Eval benchmark. — No information is provided on the generalizability of ChartLens to charts outside the tested domains (finance, policy, economics). More in Limitations →

Paper Preview

Abstract

The growing capabilities of multimodal large language models (MLLMs) have advanced tasks like chart understanding. However, these models often suffer from hallucinations, where generated text sequences conflict with the provided visual data. To address this, we introduce Post-Hoc Visual Attribution for Charts, which identifies fine-grained chart elements that validate a given 
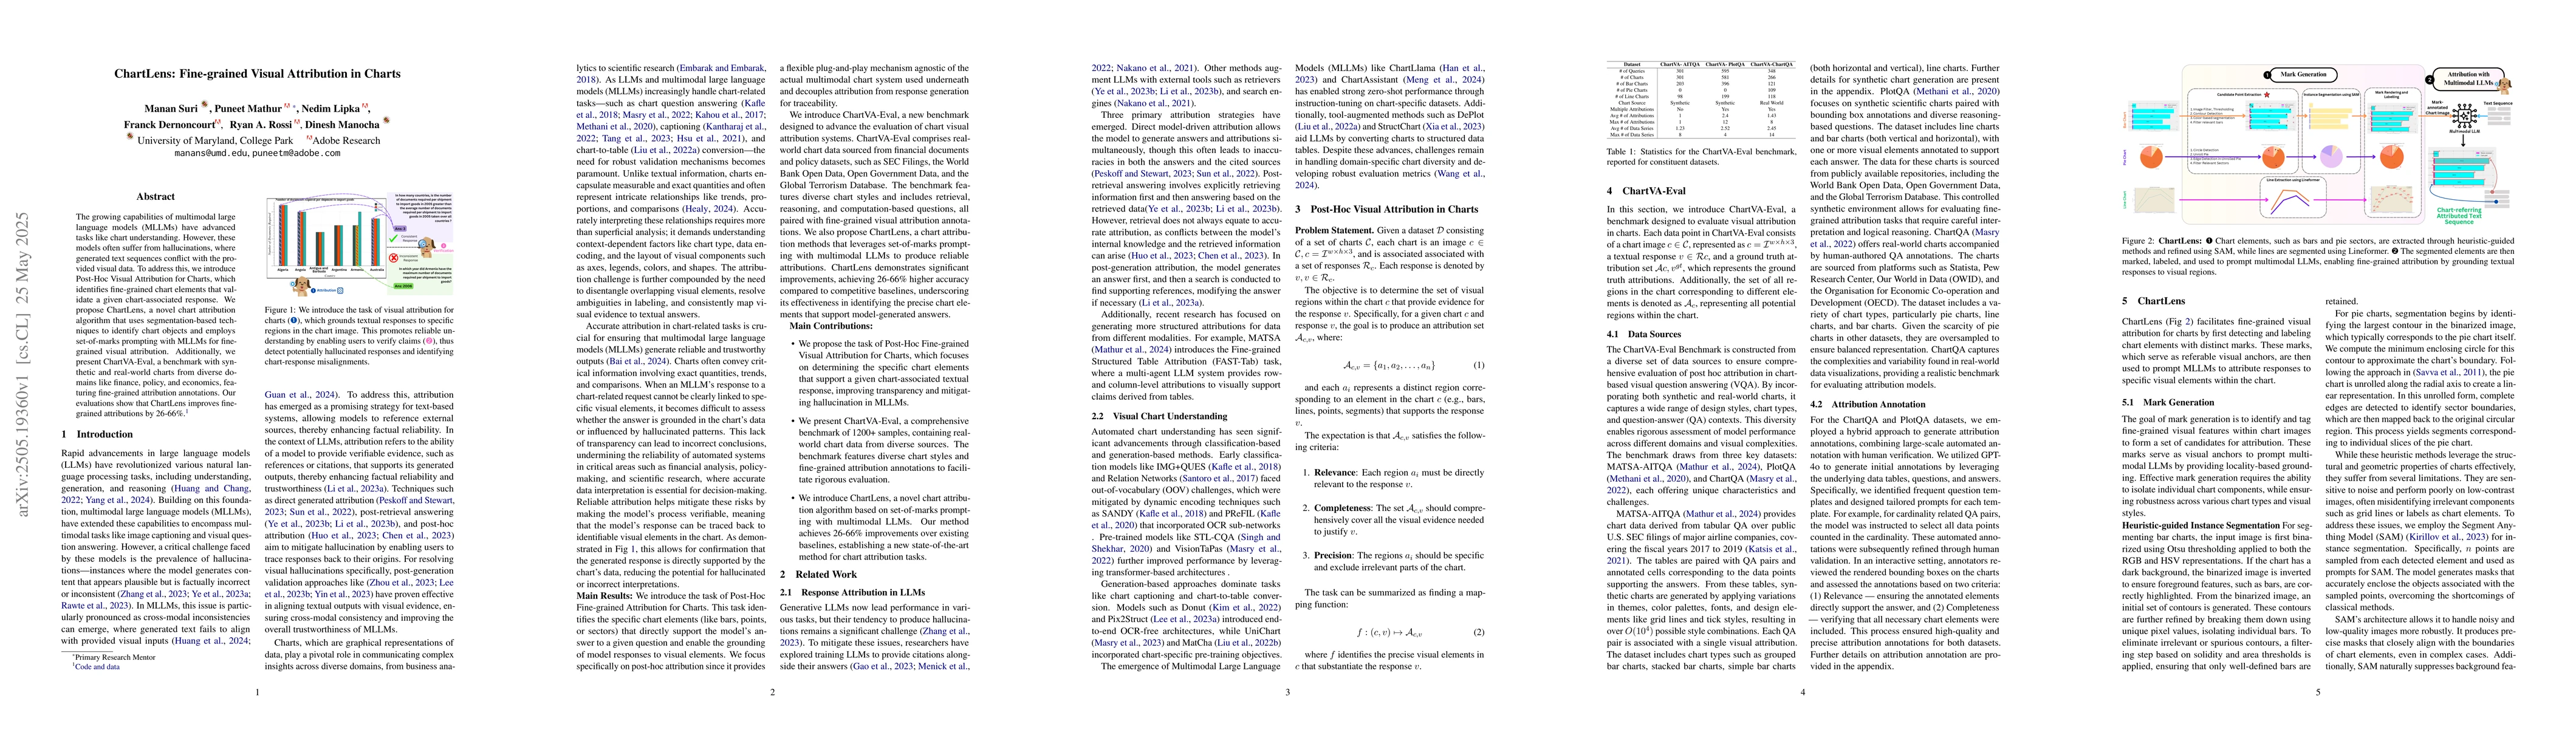
chart-associated response. We propose ChartLens, a novel chart attribution algorithm that uses segmentation-based techniques to identify chart objects and employs set-of-marks prompting with MLLMs for fine-grained visual attribution. Additionally, we present ChartVA-Eval, a benchmark with synthetic and real-world charts from diverse domains like finance, policy, and economics, featuring fine-grained attribution annotations. Our evaluations show that ChartLens improves fine-grained attributions by 26-66%.

AI Key Findings

Generated Jun 07, 2025

Methodology — What approach did the authors take?

The research introduces ChartLens, a novel chart attribution algorithm that uses segmentation-based techniques to identify chart objects and employs set-of-marks prompting with multimodal large language models (MLLMs) for fine-grained visual attribution.

Key Results — What are the main findings?

  • ChartLens improves fine-grained attributions by 26-66% as shown in evaluations.
  • The paper presents ChartVA-Eval, a benchmark with synthetic and real-world charts from diverse domains like finance, policy, and economics, featuring fine-grained attribution annotations.

Significance — Why does this research matter?

This research is important as it tackles the hallucination problem in MLLMs when dealing with chart understanding, thereby enhancing the reliability of generated text sequences concerning provided visual data.

Technical Contribution — What is the technical contribution?

ChartLens, a segmentation-based chart attribution algorithm combined with set-of-marks prompting for fine-grained visual attribution using MLLMs.

Novelty — What is new about this work?

ChartLens and ChartVA-Eval benchmark distinguish this work by providing a targeted solution to fine-grained chart attribution and a comprehensive evaluation set for chart understanding tasks.

Limitations — What are the limitations of this study?

  • The paper does not discuss potential limitations or challenges encountered in developing ChartLens or creating the ChartVA-Eval benchmark.
  • No information is provided on the generalizability of ChartLens to charts outside the tested domains (finance, policy, economics).

Future Work — What did the authors propose for future work?

  • Exploring the applicability of ChartLens to other chart types and domains not covered in the benchmark.
  • Investigating methods to further reduce hallucinations in MLLMs for chart understanding tasks.

Paper Details

Paper ID: 2505.19360
Comments: ACL 2025 (Main)
Categories:
cs.CL

How to Cite This Paper

BibTeX
@article{manocha2025chartlens,
  title         = {ChartLens: Fine-grained Visual Attribution in Charts},
  author        = {Manocha, Dinesh and Dernoncourt, Franck and Suri, Manan and others},
  year          = {2025},
  eprint        = {2505.19360},
  archivePrefix = {arXiv},
  primaryClass  = {cs.CL},
}
APA 7
Manocha, D., Dernoncourt, F., Suri, M., Lipka, N., Mathur, P., & Rossi, R. (2025). ChartLens: Fine-grained Visual Attribution in Charts. arXiv. https://arxiv.org/abs/2505.19360
MLA 9
Manocha, Dinesh, et al. "ChartLens: Fine-grained Visual Attribution in Charts." arXiv, 2025, arxiv.org/abs/2505.19360.

Citation Network

Current paper (gray), citations (green), references (blue)

Display is limited for performance on very large graphs.

Current Paper
Citations
References
Click to view

Similar Papers

Found 4 papers

ChartCitor: Multi-Agent Framework for Fine-Grained Chart Visual Attribution

Kanika Goswami, Puneet Mathur, Ryan Rossi et al.

2025-02-03

Fine-Grained Visual Prompting

Lingfeng Yang, Yueze Wang, Xiang Li et al.

2023-12-13

Fine-Grained Visual Entailment

Shih-Fu Chang, Yipeng Zhang, Christopher Thomas

2022-03-30

No citations found for this paper.

Comments (0)

This website uses cookies to ensure you get the best experience. Learn more