Chronological Outlooks of Globe Illustrated with Web-Based Visualization
Publication
Metrics
AI Quick Summary
This research explores the use of web-based visualization tools, including Plotly, Plotly.js, and D3.js, to analyze global trends in terrorism, air quality, and population dynamics. A unified web homepage provides links to detailed visualizations hosted on cloud servers like Vercel and Render, enhancing understanding and analysis of complex global issues.
Paper Preview
Abstract
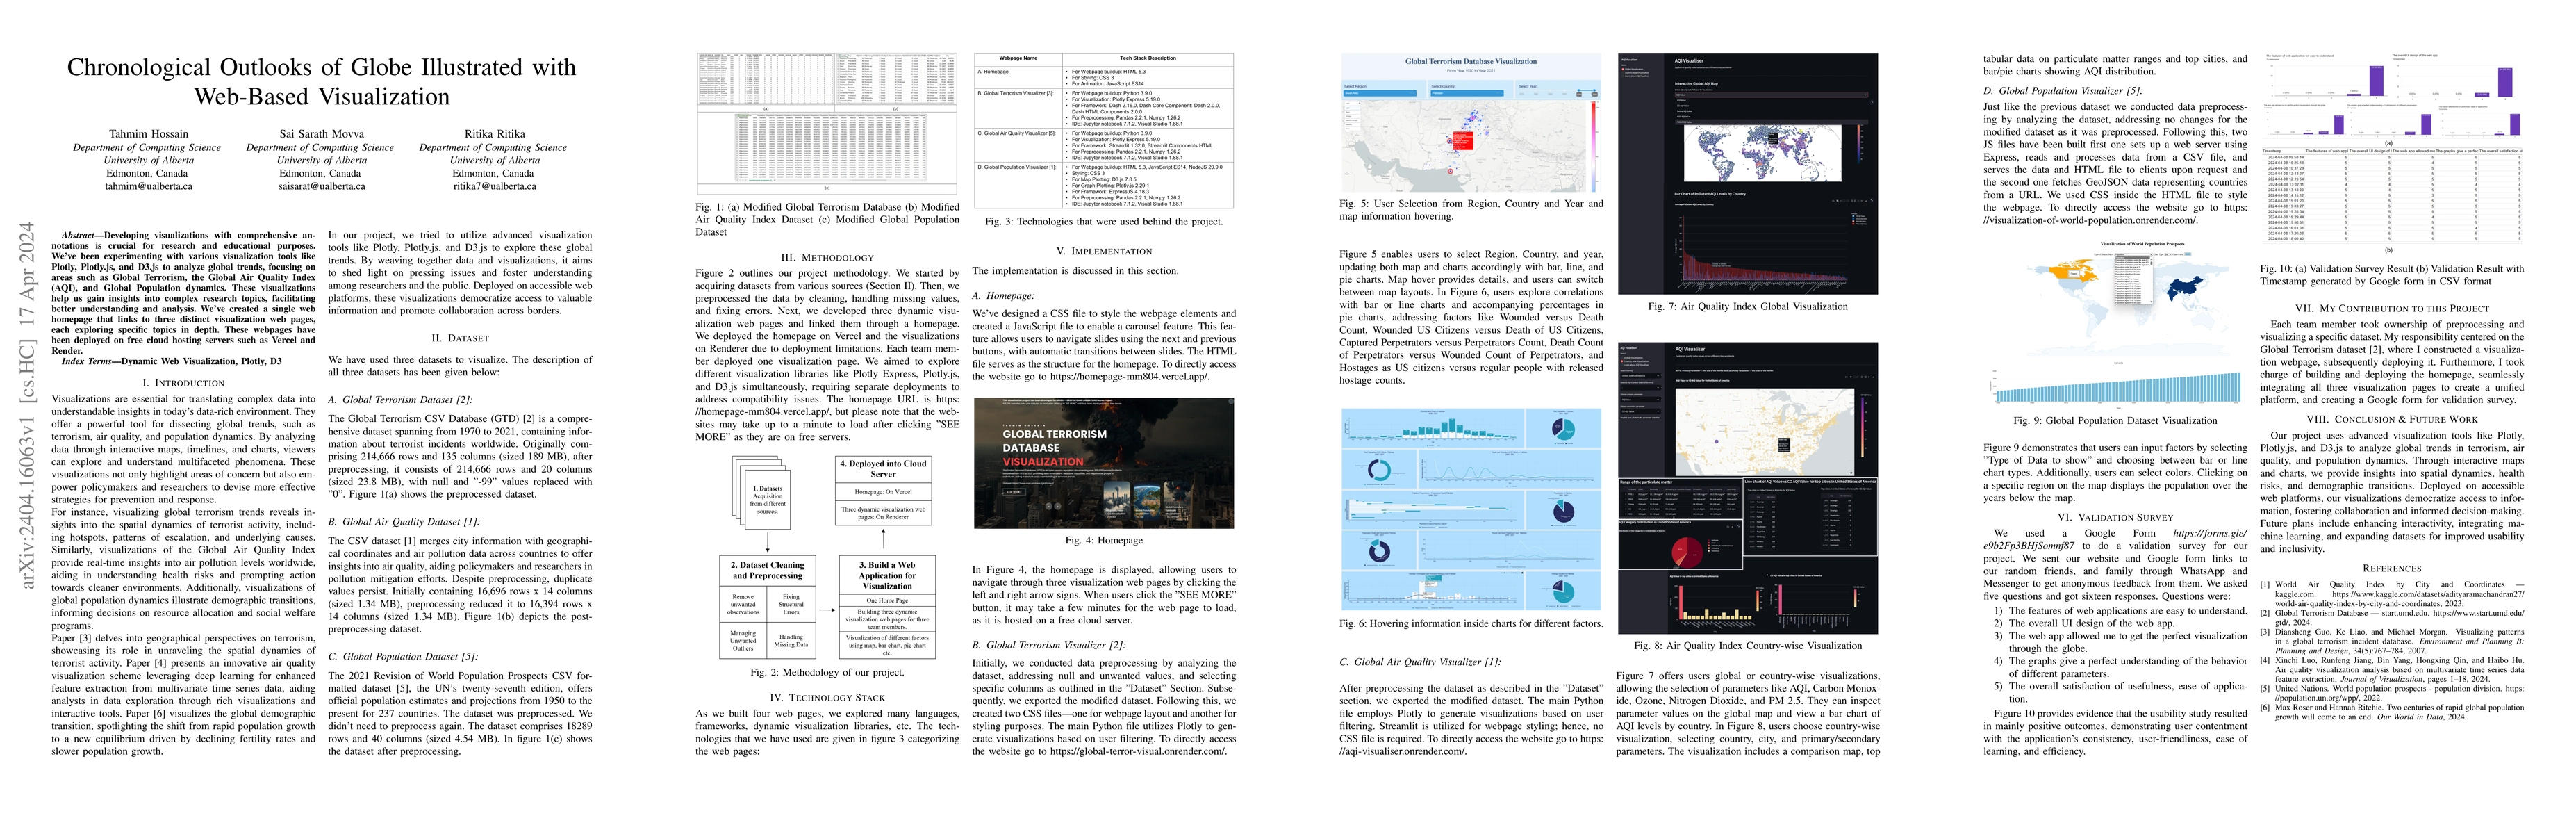
Developing visualizations with comprehensive annotations is crucial for research and educational purposes. We've been experimenting with various visualization tools like Plotly, Plotly.js, and D3.js to analyze global trends, focusing on areas such as Global Terrorism, the Global Air Quality Index (AQI), and Global Population dynamics. These visualizations help us gain insights into complex research topics, facilitating better understanding and analysis. We've created a single web homepage that links to three distinct visualization web pages, each exploring specific topics in depth. These webpages have been deployed on free cloud hosting servers such as Vercel and Render.
AI Key Findings
Get AI-generated insights about this paper's methodology, results, significance, and more — seven facets brought into focus.
Impact
Paper Details
Authors
PDF Preview
Key Terms
Citation Network
Current paper (gray), citations (green), references (blue)
Display is limited for performance on very large graphs.
Discussion 0