Background
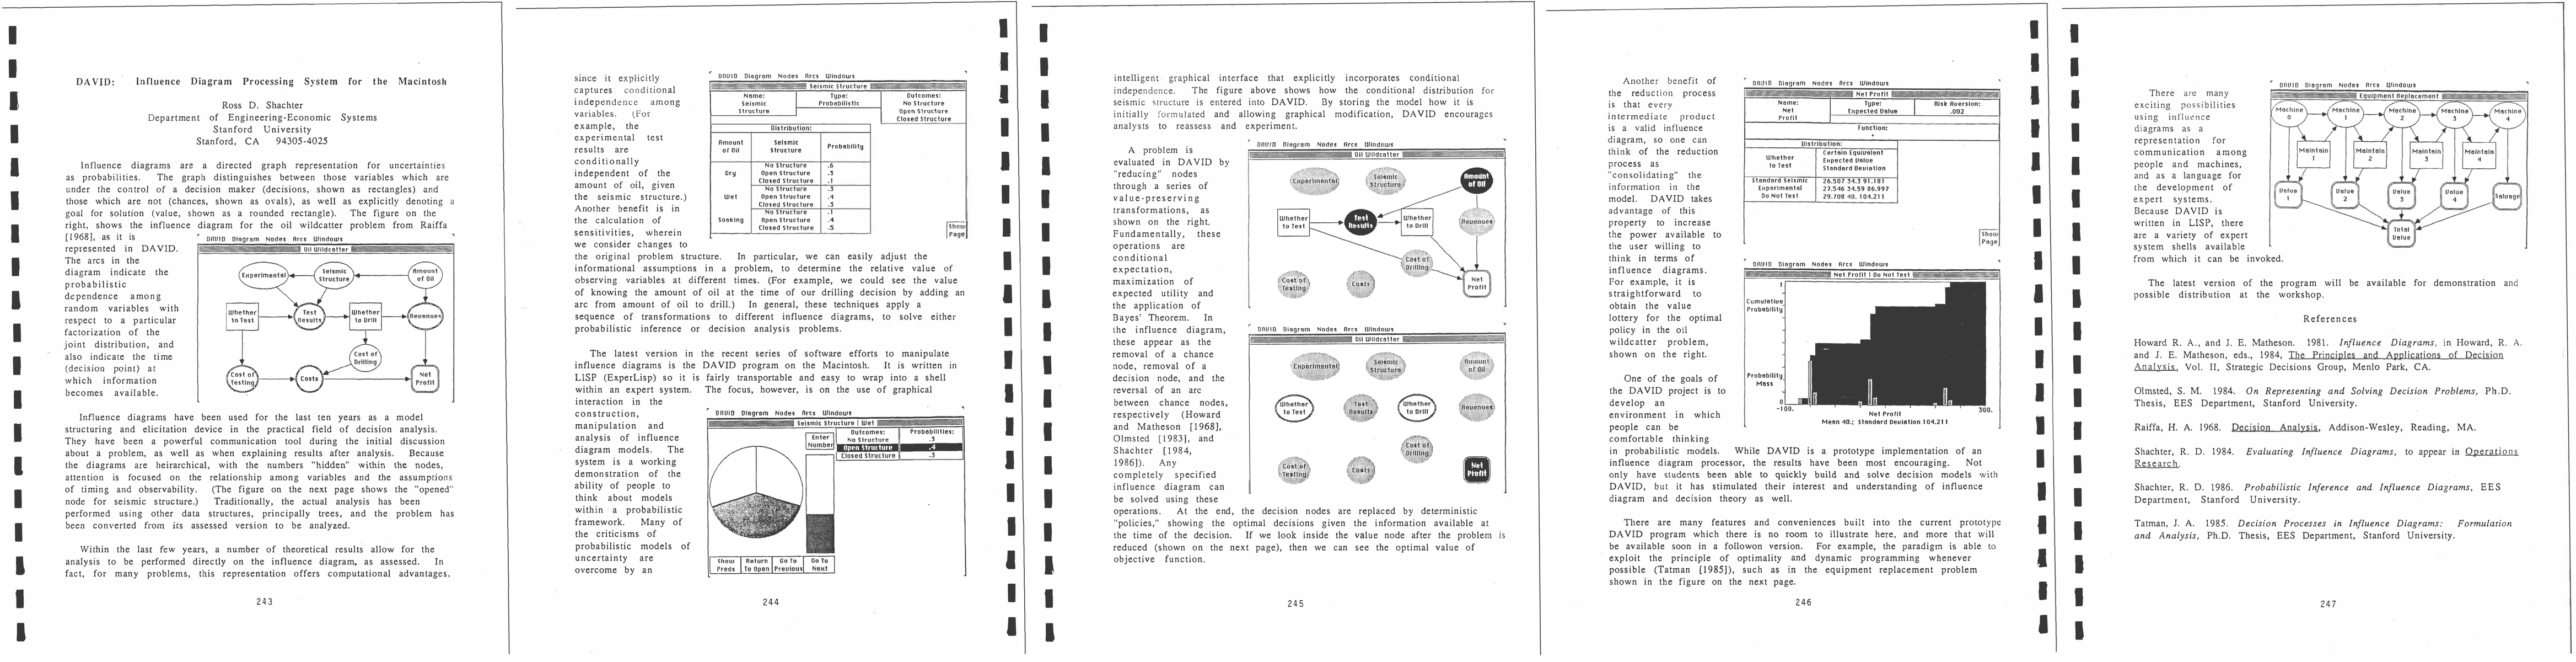
Influence diagrams are a directed graphical representation that encodes probabilistic uncertainties, decisions, and values. They distinguish decision nodes (rectangles), chance nodes (ovals), and value nodes (rounded rectangles), and the arcs convey probabilistic dependencies as well as the timing at which information becomes available. Historically, practitioners used trees and other data structures to perform analysis, often transforming the problem to a format more amenable to computation rather than preserving the diagrammatic structure for analysis and communication. The approach emphasizes that the diagrammatic form reveals conditional independence and information flow, supporting clearer elicitation and reasoning about the problem.
Problem / Research Question
The central challenge addressed is how to perform direct probabilistic inference and decision analysis on influence diagrams in their assessed form, rather than after converting to alternative representations. The authors seek a tool that (a) preserves the diagrammatic structure, (b) enables easy modification of informational assumptions (timing and observability), and (c) supports a sequence of transformations to solve problems. A key question is whether a graphical, interactive system can expose the value of information and facilitate sensitivity analysis in a user-friendly way.
Innovation / Contribution
DAVID represents a practical software embodiment of influence diagrams on the Macintosh, implemented in Lisp (ExperLisp). Its core contributions are: a graphical interface for constructing and editing influence diagrams, explicit support for node types and temporal information, and a transformation-based workflow to perform both probabilistic inference and decision analysis directly on the diagram. The system makes it straightforward to adjust what is known when (e.g., adding an arc from a quantity to a decision to model acquiring that information), thereby enabling rapid exploration of informational value and sequencing. The work also emphasizes communication and model-building as a primary aim, positioning DAVID as a demonstration of how people can think about probabilistic models when the model is visually accessible.
Methodology / Approach
Nodes are typed as decisions, chances, or values, and arcs encode probabilistic dependencies and the timing of information. The user constructs an influence diagram and applies a sequence of transformations to derive the solution to inference or decision problems. The approach highlights that many problems can be analyzed directly on the assessed diagram, potentially with computational advantages stemming from explicit conditional independence. The paper discusses the Seismic Structure and Oil Structure examples to illustrate how the diagram embodies the underlying dependencies and how results reflect the information available at each decision point.
Experiments / Evaluation
The work references experimental test results illustrating conditional independence properties (for example, certain outcomes being independent of oil amount given seismic structure). The emphasis of evaluation is primarily demonstration rather than formal benchmarking: the graphical system allows users to verify sensitivity to information timing and to validate the logical flow of dependencies. The reported demonstrations argue for the practicality of the approach and its capacity to reveal the value (or lack) of additional information, rather than providing a rigorous, large-scale empirical comparison.
Key Results
DAVID enables direct manipulation of assessed influence diagrams, preserving structure and timing while enabling transformations to solve probabilistic and decision problems. It supports adjustment of informational assumptions (adding or removing information-flow arcs) and demonstrates that dependence structures can be exploited to simplify computation. The tool also serves as a communications aid, helping problem owners and analysts discuss and align on model assumptions. The examples show how equivalent or improved insights can be obtained without abandoning the diagrammatic representation.
Practical Applications
The system is positioned as a versatile platform for decision analysis, probabilistic reasoning, and model communication. Its Macintosh implementation and Lisp foundation make it portable within shell environments and amenable to integration with expert-system frameworks. The graphical interface is intended to facilitate stakeholder discussions, model elicitation, and rapid experimentation with different information structures. The authors anticipate broad applicability in decision analysis domains where uncertainty and timing of information are critical.
Limitations & Considerations
The paper acknowledges broader criticisms of probabilistic models, suggesting that graphical tools like DAVID can mitigate some concerns through clearer representation and interaction. However, the description emphasizes that this is a working demonstration rather than a fully validated, production-scale system. Potential limitations include platform specificity (Macintosh/Lisp), the absence of detailed performance benchmarks, and an incomplete account of how the underlying algorithms scale to larger, more complex diagrams. The emphasis on user interaction over exhaustive empirical evaluation leaves open questions about computational limits, data handling for continuous distributions, and interoperability with other modeling environments.
Discussion 0