Publication
Metrics
Paper Preview
Abstract
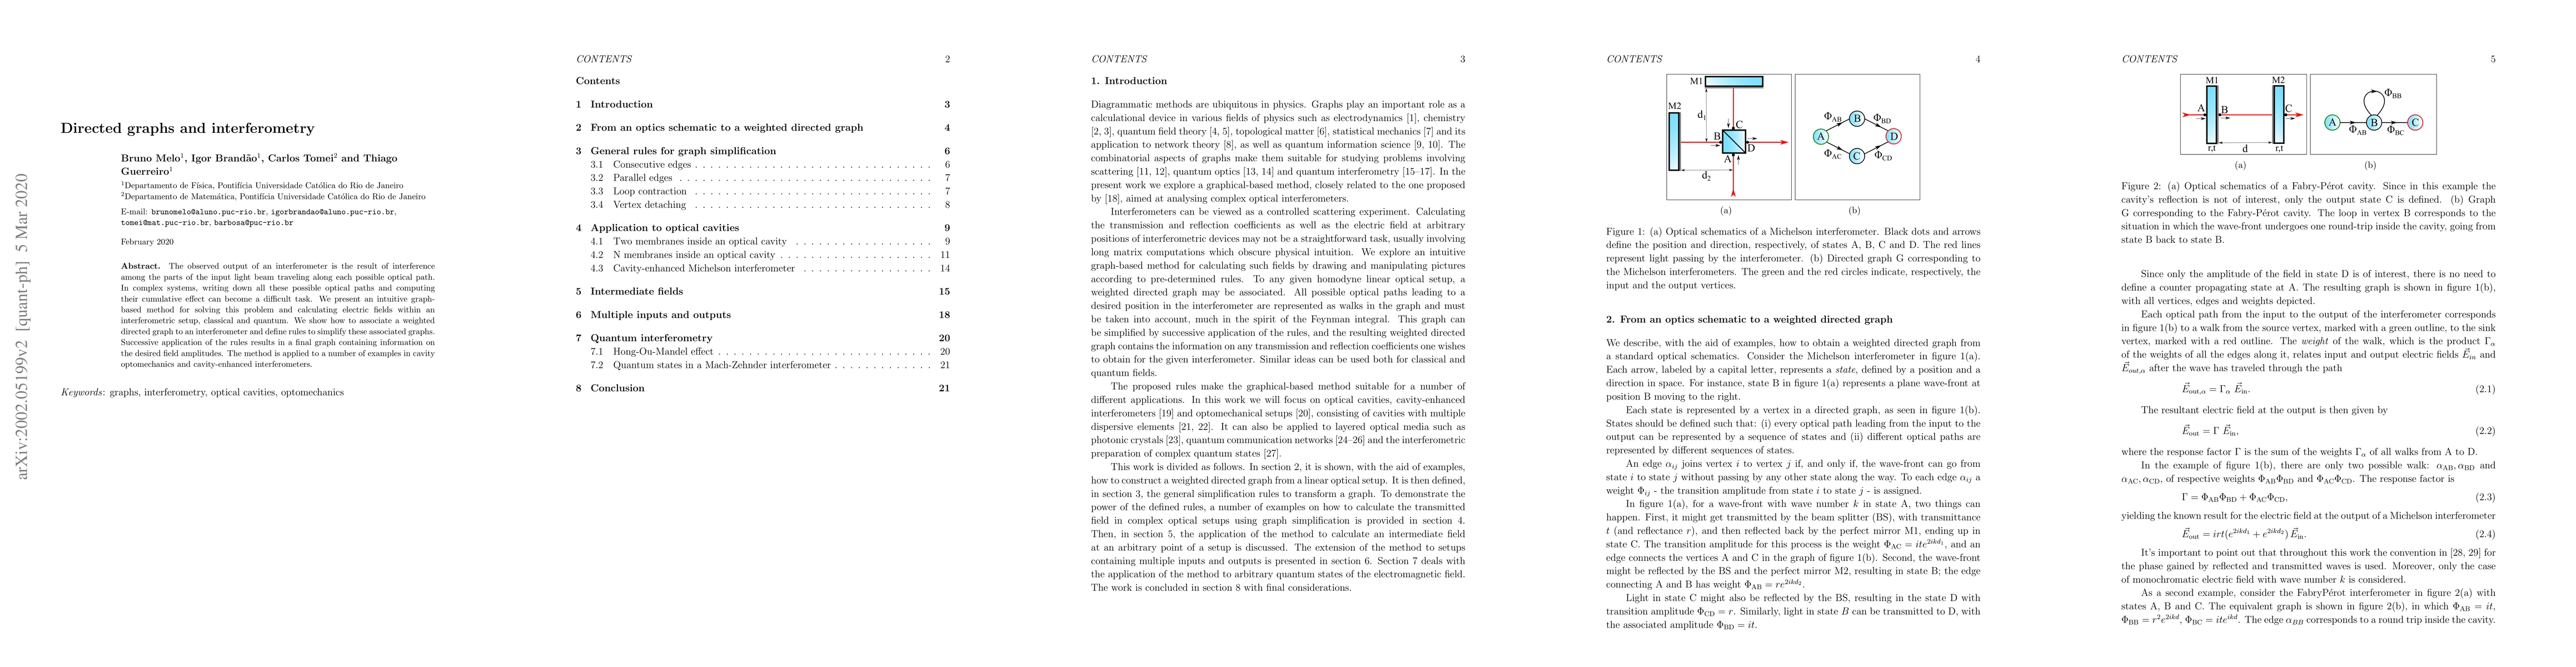
The observed output of an interferometer is the result of interference among the parts of the input light beam traveling along each possible optical path. In complex systems, writing down all these possible optical paths and computing their cumulative effect can become a difficult task. We present an intuitive graph-based method for solving this problem and calculating electric fields within an interferometric setup, classical and quantum. We show how to associate a weighted directed graph to an interferometer and define rules to simplify these associated graphs. Successive application of the rules results in a final graph containing information on the desired field amplitudes. The method is applied to a number of examples in cavity optomechanics and cavity-enhanced interferometers.
AI Key Findings
Get AI-generated insights about this paper's methodology, results, significance, and more — seven facets brought into focus.
Impact
Paper Details
Authors
PDF Preview
Key Terms
Citation Network
Current paper (gray), citations (green), references (blue)
Display is limited for performance on very large graphs.
Discussion 0