Abstract
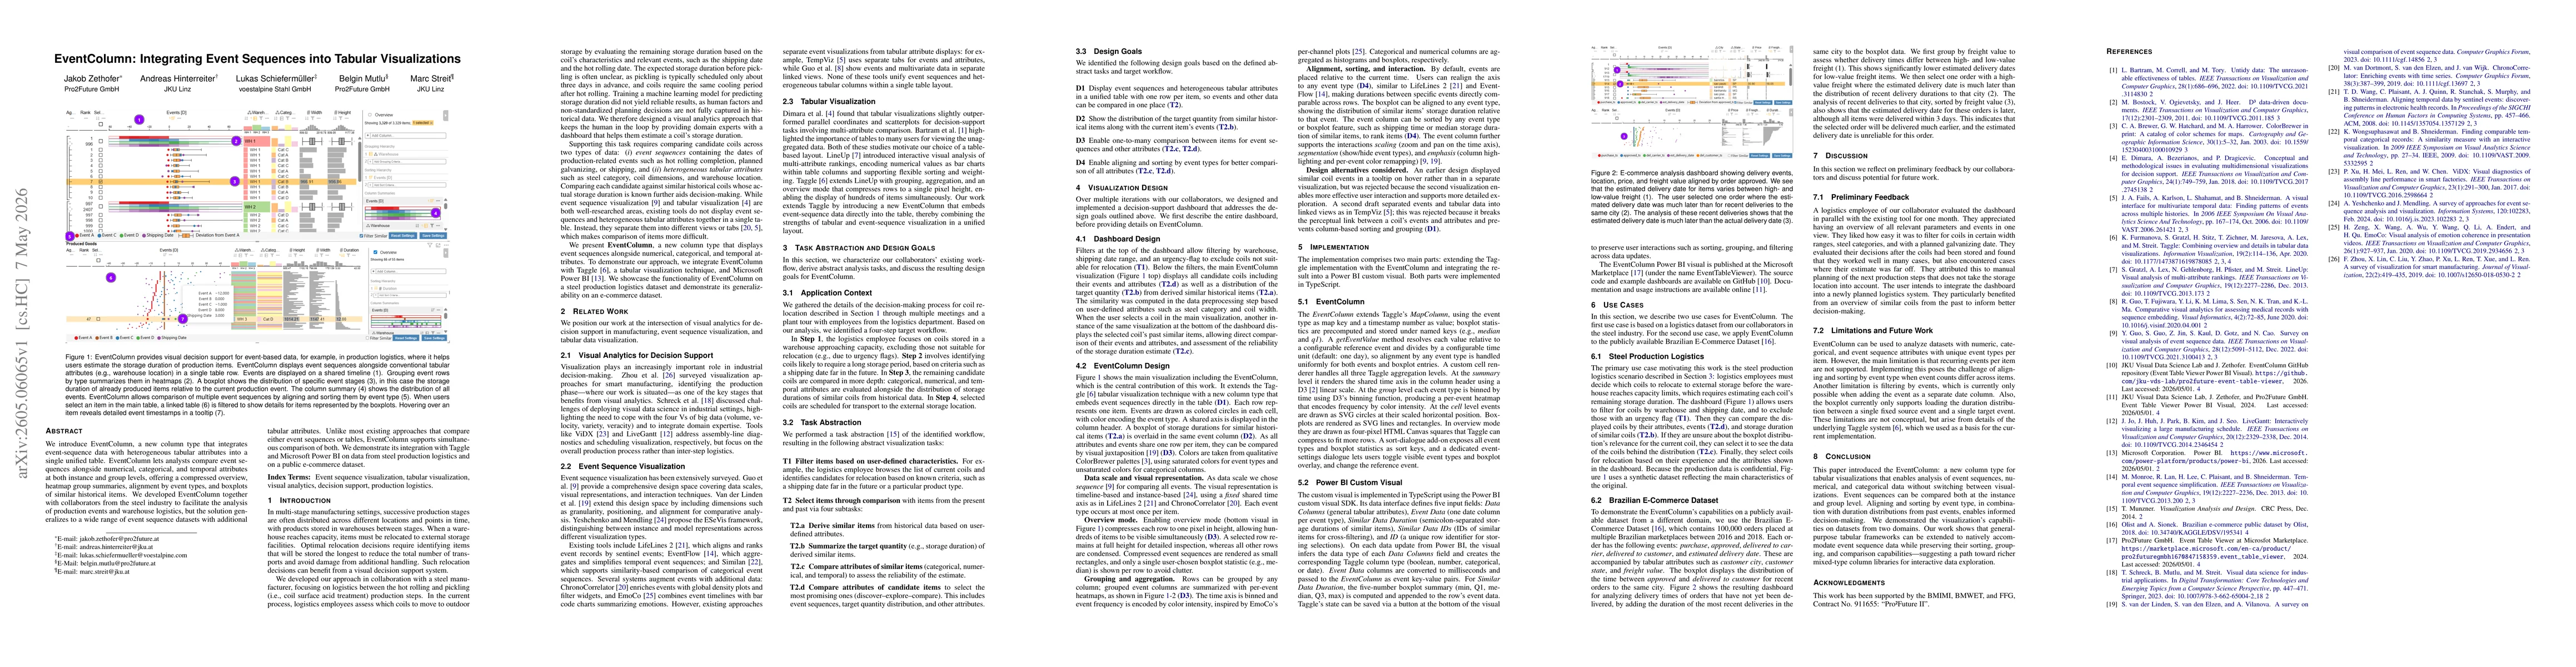
We introduce EventColumn, a new column type that integrates event-sequence data with heterogeneous tabular attributes into a single unified table. EventColumn lets analysts compare event sequences alongside numerical, categorical, and temporal attributes at both instance and group levels, offering a compressed overview, heatmap group summaries, alignment by event types, and boxplots of similar historical items. We developed EventColumn together with collaborators from the steel industry to facilitate the analysis of production events and warehouse logistics, but the solution generalizes to a wide range of event sequence datasets with additional tabular attributes. Unlike most existing approaches that compare either event sequences or tables, EventColumn supports simultaneous comparison of both. We demonstrate its integration with Taggle and Microsoft Power BI on data from steel production logistics and on a public e-commerce dataset.
AI Key Findings
Generated May 09, 2026
Methodology
The study presents EventColumn, a new table column type integrated into Taggle and Power BI to combine event sequences with heterogeneous tabular attributes in a single table. It includes a shared time axis for events, per-event heatmaps, boxplots of durations for similar historical items, alignment by event types, and interactive features (sort, filter, zoom, pan). Implementation spans extending Taggle with the new column type and building a Power BI custom visual; evaluation is demonstrated on a steel production logistics dataset and a public e-commerce dataset with synthetic data for confidentiality.
Key Results
- EventColumn enables one-row-per-item display where event sequences and tabular attributes are comparable within a unified view, addressing the need for simultaneous sequence and attribute comparison.
- The overview shows a per-row shared time axis with per-event heatmaps and an overlaid boxplot for durations of similar historical items, aiding distributional understanding of storage durations.
- Alignment and sorting by event type enables direct cross-attribute comparability across items and supports grouping/aggregation for scalable visualization of hundreds of items.
- Linked details via a bottom panel allow viewing past similar items for selected coils, facilitating direct validation of duration estimates against historical data.
- The approach is demonstrated with integration into Taggle and a Power BI custom visual, proving generalizability to other event-sequence datasets.
Significance
This work unifies event-sequence visualization with heterogeneous tabular data in a single table, enabling compressed overviews, group summaries, and direct item-to-item comparisons for decision support in manufacturing and logistics, which previously relied on separate views for events and attributes.
Technical Contribution
Introduction of EventColumn, a novel tabular column type that embeds event sequences within table rows, including a shared time axis, per-event heatmaps, and integrated boxplots; extension of Taggle and creation of a Power BI custom visual to realize unified event-sequence and tabular data visualization in a single table.
Novelty
First work to unify event-sequence visualization with heterogeneous tabular attributes inside a single tabular layout, enabling simultaneous comparison across instance and group levels with alignment by event types and integrated distribution summaries.
Limitations
- Recurring events per item are not supported, limiting analysis of items with repeated event types.
- Event filtering is restricted to scenarios where the event is represented as a separate column, reducing filter flexibility.
- The boxplot currently supports dispersion from a single fixed source event to a single target event, limiting multi-source comparisons.
Future Work
- Support recurring events per item to enable alignment and sorting when event counts differ across items.
- Enhance event filtering to allow filtering directly by event attributes without needing separate columns.
- Extend boxplot and aggregation capabilities to handle multiple source/target event combinations and richer distributions.
- Improve scalability and performance for even larger datasets and explore additional domain applications beyond steel and e-commerce.
Paper Details
PDF Preview
Similar Papers
Found 4 papersAudioScene: Integrating Object-Event Audio into 3D Scenes
Shuaihang Yuan, Congcong Wen, Muhammad Shafique et al.
DATGAN: Integrating expert knowledge into deep learning for synthetic tabular data
Michel Bierlaire, Gael Lederrey, Tim Hillel
Taggle: Combining Overview and Details in Tabular Data Visualizations
Alexander Lex, Thomas Zichner, Samuel Gratzl et al.
Beyond Isolated Clients: Integrating Graph-Based Embeddings into Event Sequence Models
Harry Proshian, Nikita Severin, Sergey Nikolenko et al.
Comments (0)