This study integrates causal inference frameworks with large-scale financial data analysis, leveraging synthetic panel data generation and knowledge graph (KG) structures to uncover direct financial relationships.
FinCARE: Financial Causal Analysis with Reasoning and Evidence
Publication
Metrics
Quick Answers
What methodology did the authors use?
This study integrates causal inference frameworks with large-scale financial data analysis, leveraging synthetic panel data generation and knowledge graph (KG) structures to uncover direct financial relationships. More in Methodology →
What are the key results?
The KG-informed synthetic data approach successfully identified 29 persistent causal relationships across 500 firms over 15 years. — Counterfactual interventions demonstrated measurable impacts on key financial metrics such as returns and margins. More in Key Results →
Why is this work significant?
This research advances financial causality analysis by providing a scalable framework for understanding complex risk transmission mechanisms and strategic event impacts. More in Significance →
What are the main limitations?
Synthetic data may not fully capture real-world market dynamics — The KG structure relies on pre-existing domain knowledge More in Limitations →
Abstract
Portfolio managers rely on correlation-based analysis and heuristic methods that fail to capture true causal relationships driving performance. We present a hybrid framework that integrates statistical causal discovery algorithms with domain knowledge from two complementary sources: a financial knowledge graph extracted from SEC 10-K filings and large language model reasoning. Our approach systematically enhances three representative causal discovery paradigms, constraint-based (PC), score-based (GES), and continuous optimization (NOTEARS), by encoding knowledge graph constraints algorithmically and leveraging LLM conceptual reasoning for hypothesis generation. Evaluated on 
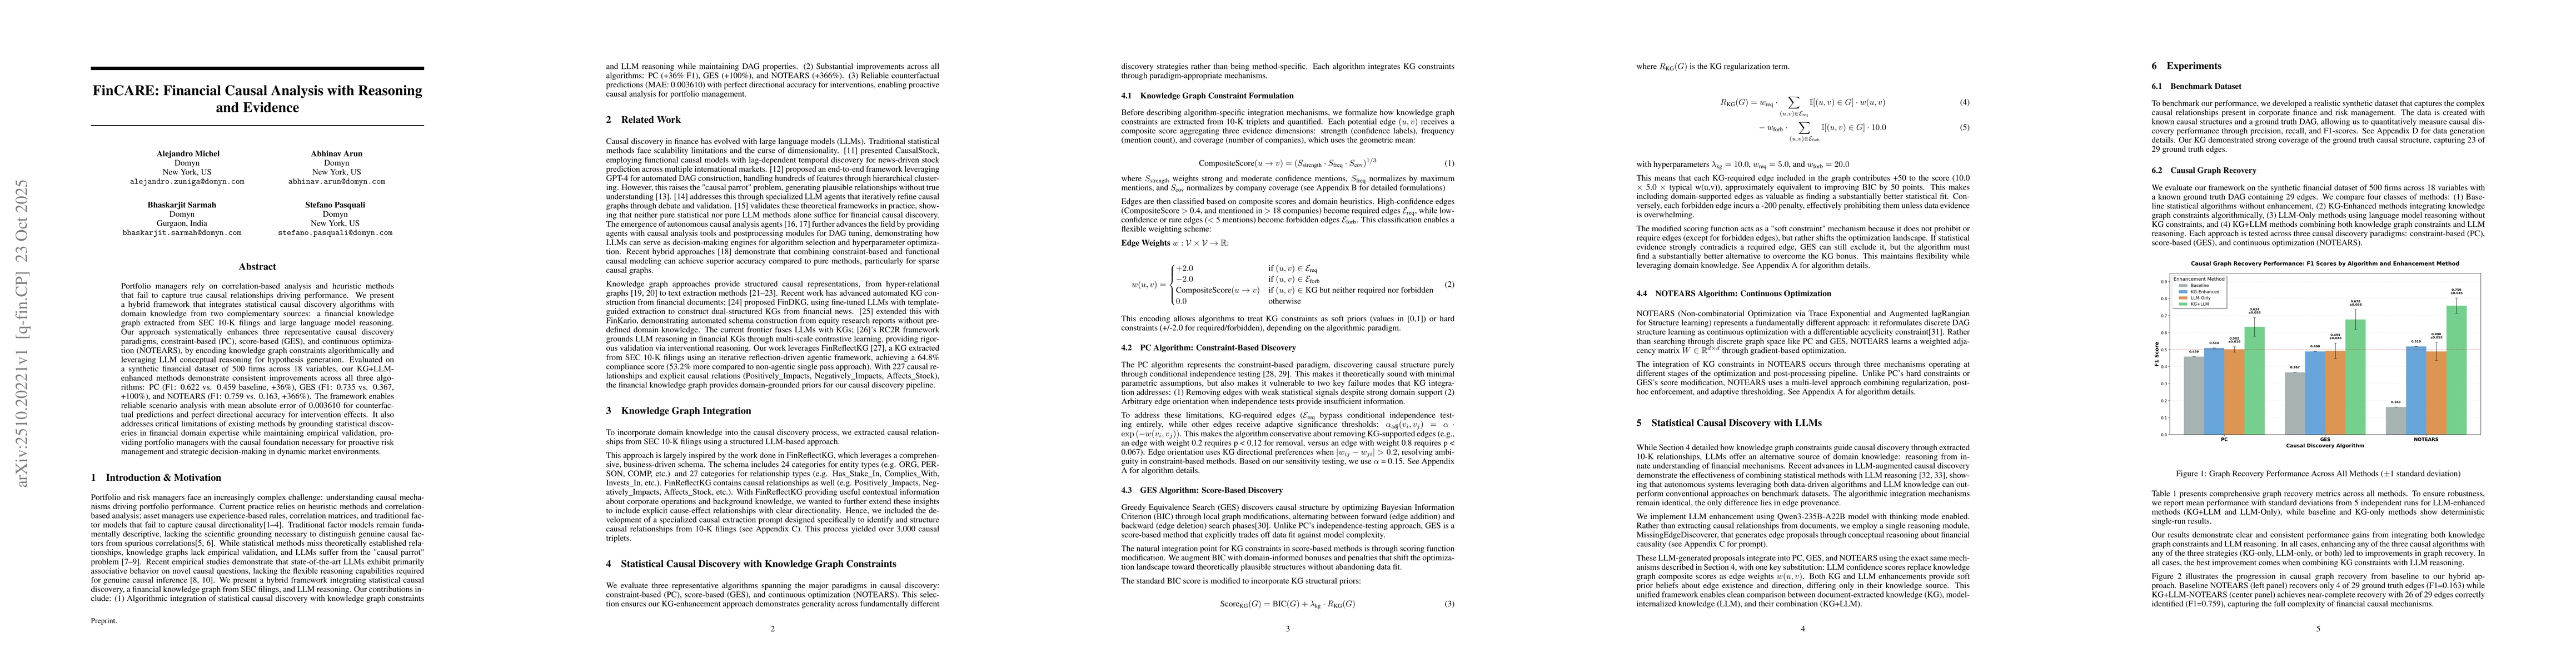
a synthetic financial dataset of 500 firms across 18 variables, our KG+LLM-enhanced methods demonstrate consistent improvements across all three algorithms: PC (F1: 0.622 vs. 0.459 baseline, +36%), GES (F1: 0.735 vs. 0.367, +100%), and NOTEARS (F1: 0.759 vs. 0.163, +366%). The framework enables reliable scenario analysis with mean absolute error of 0.003610 for counterfactual predictions and perfect directional accuracy for intervention effects. It also addresses critical limitations of existing methods by grounding statistical discoveries in financial domain expertise while maintaining empirical validation, providing portfolio managers with the causal foundation necessary for proactive risk management and strategic decision-making in dynamic market environments.
Key Findings, in focus
Seven facets of this paper, analysed and brought into focus by AI.
This research advances financial causality analysis by providing a scalable framework for understanding complex risk transmission mechanisms and strategic event impacts.
- The KG-informed synthetic data approach successfully identified 29 persistent causal relationships across 500 firms over 15 years.
- Counterfactual interventions demonstrated measurable impacts on key financial metrics such as returns and margins.
- The methodology achieved 0.3610 average MAE across multiple intervention scenarios.
This research advances financial causality analysis by providing a scalable framework for understanding complex risk transmission mechanisms and strategic event impacts.
Development of a KG-informed synthetic panel data generation algorithm that incorporates nonlinear relationships and domain-specific noise structures
Combines causal graph validation with synthetic data generation for robust financial relationship discovery, differing from traditional correlation-based approaches
- Synthetic data may not fully capture real-world market dynamics
- The KG structure relies on pre-existing domain knowledge
- Temporal persistence assumptions may oversimplify complex financial interactions
- Enhancing the KG with real-time data streams
- Incorporating more granular macroeconomic indicators
- Developing adaptive counterfactual generation techniques
Discussion 0