Graph Models for Biological Pathway Visualization: State of the Art and Future Challenges
Publication
Metrics
AI Quick Summary
This paper reviews the integration of multilayer networks in modeling biological pathways, highlighting the shift from traditional graph types to more complex representations. It identifies challenges in visualizing these networks and provides guidelines for future research in using multilayer networks for biological pathway visualization.
Paper Preview
Abstract
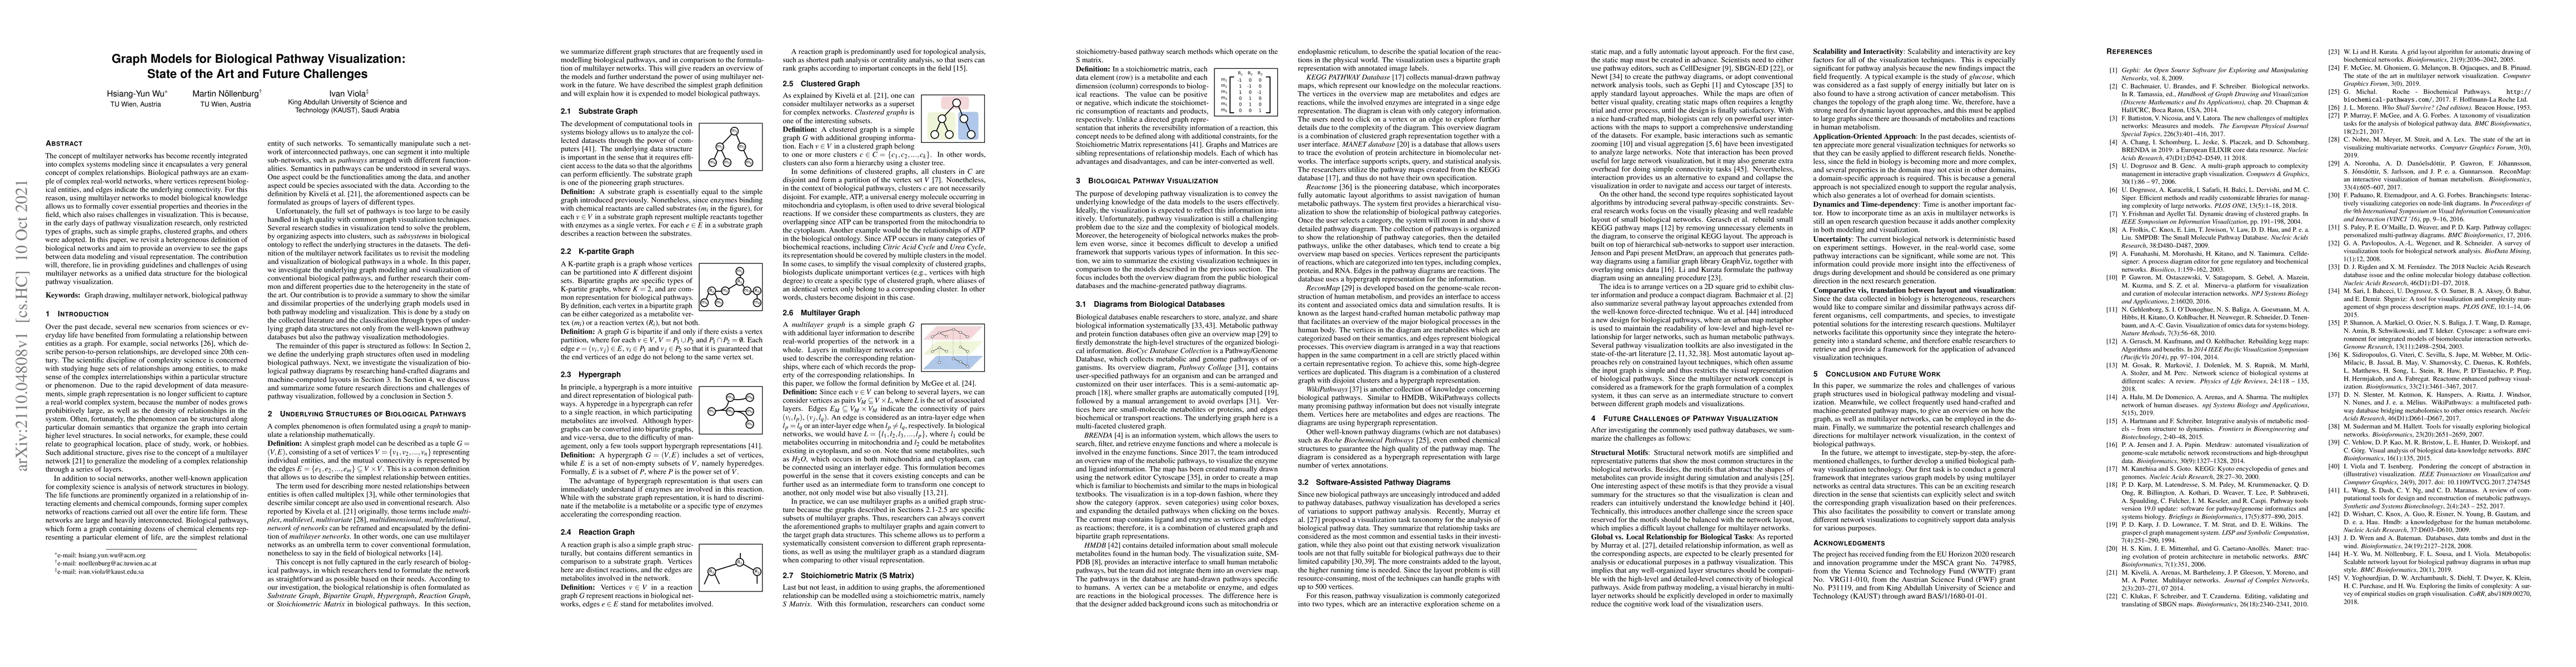
The concept of multilayer networks has become recently integrated into complex systems modeling since it encapsulates a very general concept of complex relationships. Biological pathways are an example of complex real-world networks, where vertices represent biological entities, and edges indicate the underlying connectivity. For this reason, using multilayer networks to model biological knowledge allows us to formally cover essential properties and theories in the field, which also raises challenges in visualization. This is because, in the early days of pathway visualization research, only restricted types of graphs, such as simple graphs, clustered graphs, and others were adopted. In this paper, we revisit a heterogeneous definition of biological networks and aim to provide an overview to see the gaps between data modeling and visual representation. The contribution will, therefore, lie in providing guidelines and challenges of using multilayer networks as a unified data structure for the biological pathway visualization.
AI Key Findings
Get AI-generated insights about this paper's methodology, results, significance, and more — seven facets brought into focus.
Impact
Paper Details
Authors
PDF Preview
Key Terms
Citation Network
Current paper (gray), citations (green), references (blue)
Display is limited for performance on very large graphs.
Discussion 0