New Thinking on, and with, Data Visualization
Publication
Metrics
Paper Preview
Abstract
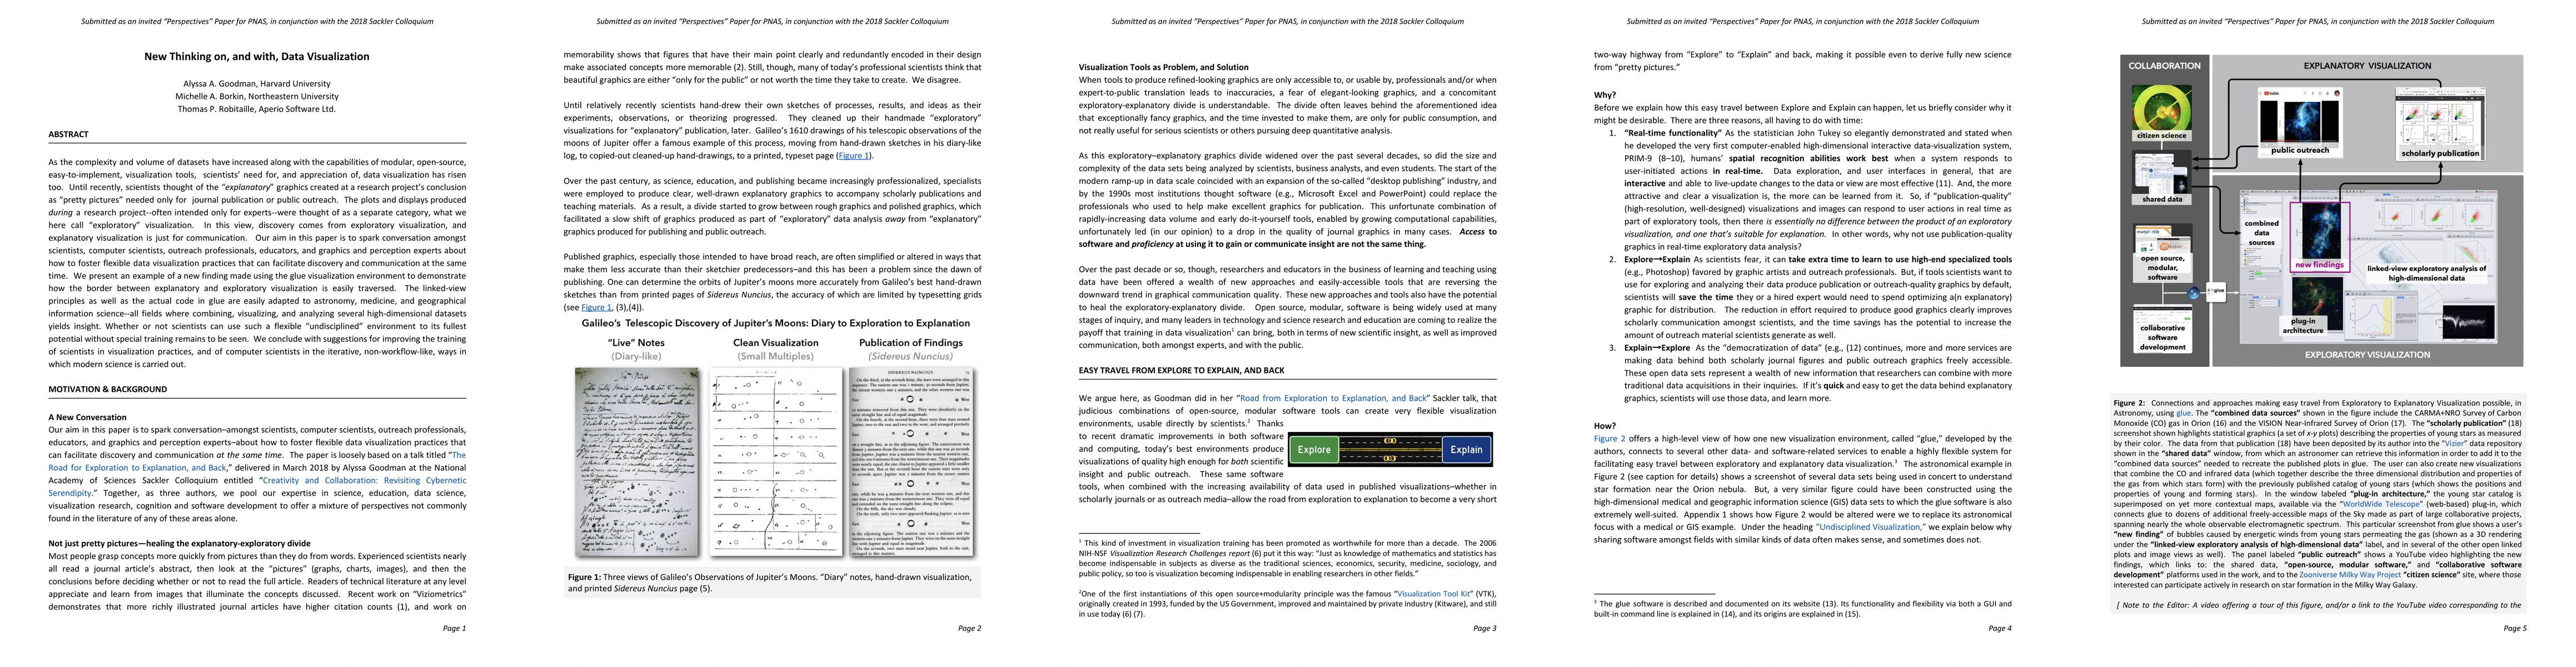
As the complexity and volume of datasets have increased along with the capabilities of modular, open-source, easy-to-implement, visualization tools, scientists' need for, and appreciation of, data visualization has risen too. Until recently, scientists thought of the "explanatory" graphics created at a research project's conclusion as "pretty pictures" needed only for journal publication or public outreach. The plots and displays produced during a research project - often intended only for experts - were thought of as a separate category, what we here call "exploratory" visualization. In this view, discovery comes from exploratory visualization, and explanatory visualization is just for communication. Our aim in this paper is to spark conversation amongst scientists, computer scientists, outreach professionals, educators, and graphics and perception experts about how to foster flexible data visualization practices that can facilitate discovery and communication at the same time. We present an example of a new finding made using the glue visualization environment to demonstrate how the border between explanatory and exploratory visualization is easily traversed. The linked-view principles as well as the actual code in glue are easily adapted to astronomy, medicine, and geographical information science - all fields where combining, visualizing, and analyzing several high-dimensional datasets yields insight. Whether or not scientists can use such a flexible "undisciplined" environment to its fullest potential without special training remains to be seen. We conclude with suggestions for improving the training of scientists in visualization practices, and of computer scientists in the iterative, non-workflow-like, ways in which modern science is carried out.
AI Key Findings
Get AI-generated insights about this paper's methodology, results, significance, and more — seven facets brought into focus.
Impact
Paper Details
PDF Preview
Key Terms
Citation Network
Current paper (gray), citations (green), references (blue)
Display is limited for performance on very large graphs.
Discussion 0