Publication
Metrics
AI Quick Summary
pyParaOcean is a Paraview plugin designed for the visual analysis of ocean data, offering scalable and interactive tools for tasks like eddy identification and salinity tracking. It leverages Paraview's distributed computing and visualization capabilities, demonstrated through a case study in the Bay of Bengal.
Paper Preview
Abstract
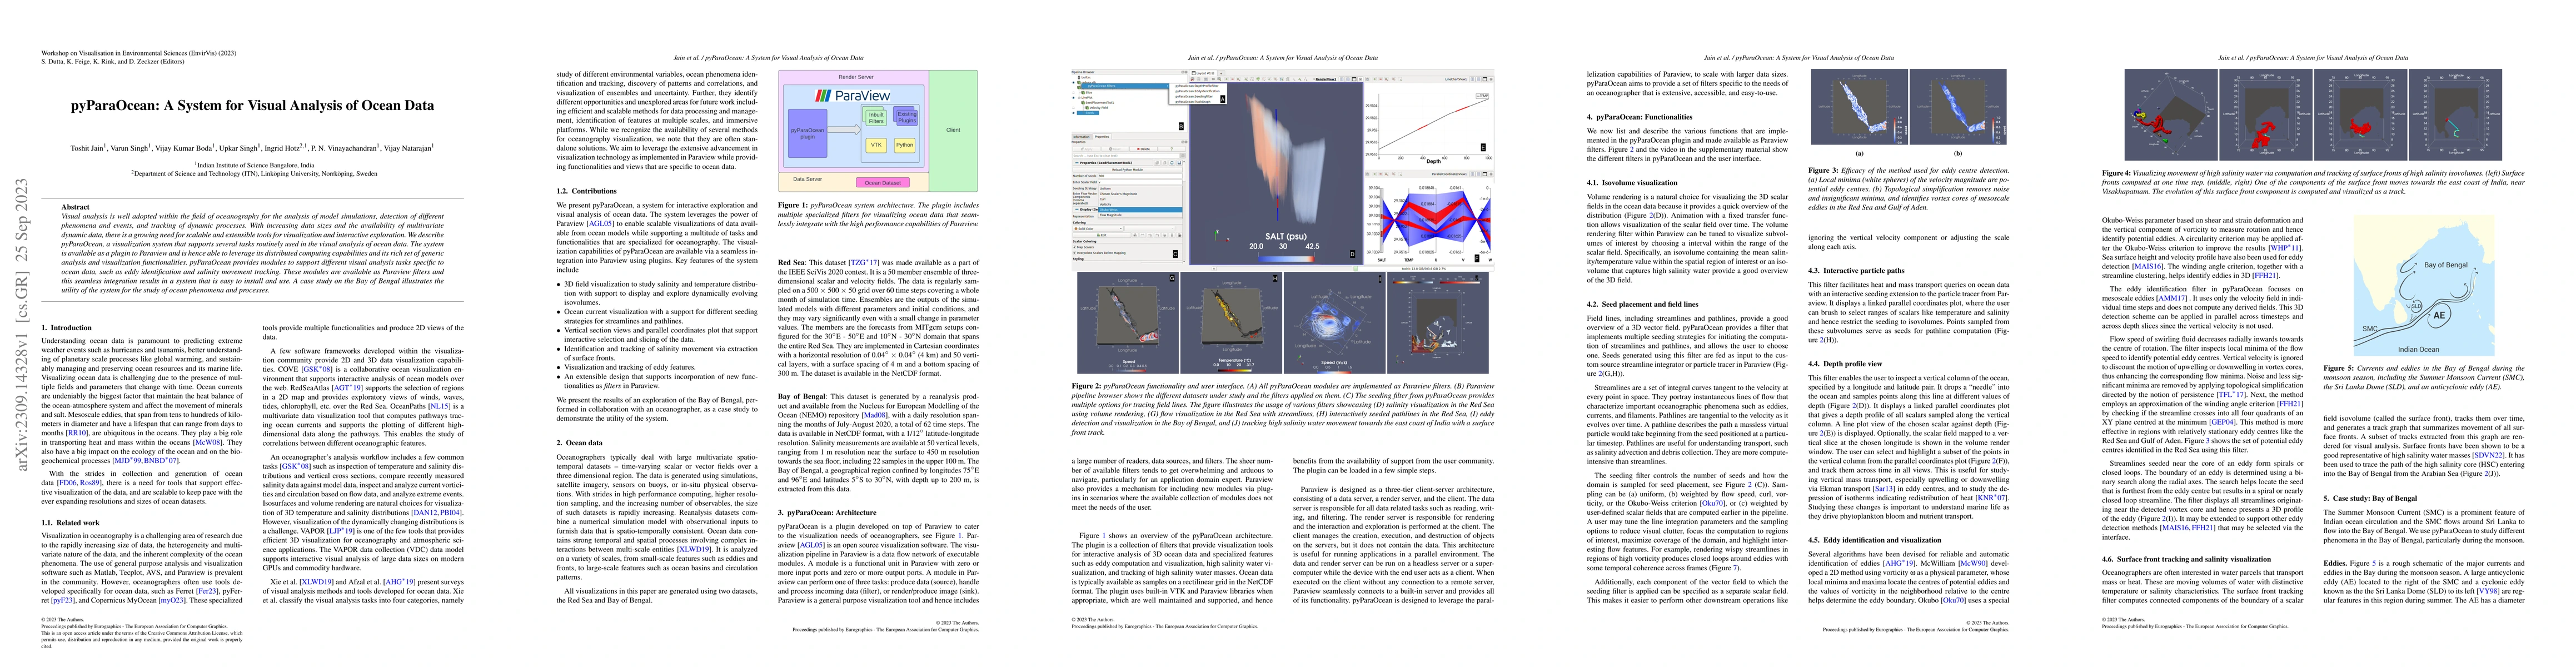
Visual analysis is well adopted within the field of oceanography for the analysis of model simulations, detection of different phenomena and events, and tracking of dynamic processes. With increasing data sizes and the availability of multivariate dynamic data, there is a growing need for scalable and extensible tools for visualization and interactive exploration. We describe pyParaOcean, a visualization system that supports several tasks routinely used in the visual analysis of ocean data. The system is available as a plugin to Paraview and is hence able to leverage its distributed computing capabilities and its rich set of generic analysis and visualization functionalities. pyParaOcean provides modules to support different visual analysis tasks specific to ocean data, such as eddy identification and salinity movement tracking. These modules are available as Paraview filters and this seamless integration results in a system that is easy to install and use. A case study on the Bay of Bengal illustrates the utility of the system for the study of ocean phenomena and processes.
AI Key Findings
Get AI-generated insights about this paper's methodology, results, significance, and more — seven facets brought into focus.
Impact
Paper Details
Authors
PDF Preview
Key Terms
Citation Network
Current paper (gray), citations (green), references (blue)
Display is limited for performance on very large graphs.
Discussion 0