Publication
Metrics
AI Quick Summary
A new study finds that using interpolation to estimate the area under the curve (AUC) of a receiver operator characteristic (ROC) curve for binary predictors can lead to misleading results, and recommends reporting the interpolation method used.
Paper Preview
Abstract
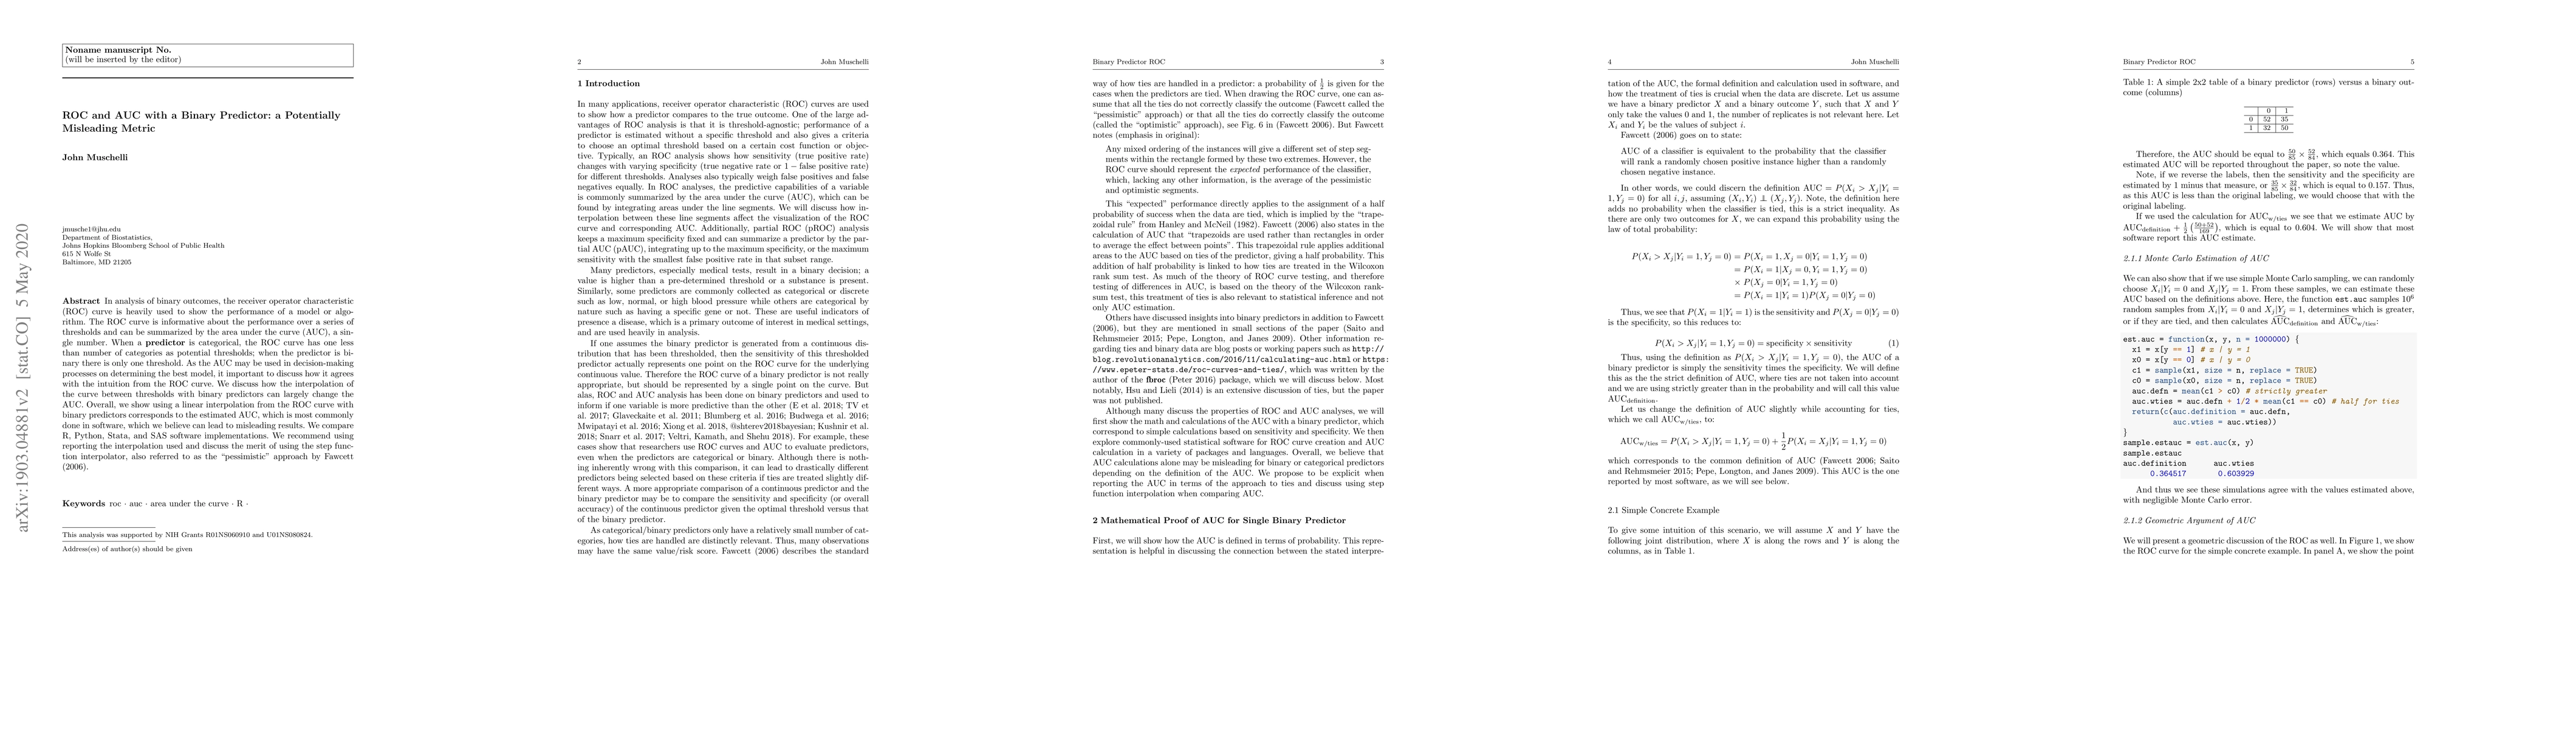
In analysis of binary outcomes, the receiver operator characteristic (ROC) curve is heavily used to show the performance of a model or algorithm. The ROC curve is informative about the performance over a series of thresholds and can be summarized by the area under the curve (AUC), a single number. When a predictor is categorical, the ROC curve has one less than number of categories as potential thresholds; when the predictor is binary there is only one threshold. As the AUC may be used in decision-making processes on determining the best model, it important to discuss how it agrees with the intuition from the ROC curve. We discuss how the interpolation of the curve between thresholds with binary predictors can largely change the AUC. Overall, we show using a linear interpolation from the ROC curve with binary predictors corresponds to the estimated AUC, which is most commonly done in software, which we believe can lead to misleading results. We compare R, Python, Stata, and SAS software implementations. We recommend using reporting the interpolation used and discuss the merit of using the step function interpolator, also referred to as the "pessimistic" approach by Fawcett (2006).
AI Key Findings
Get AI-generated insights about this paper's methodology, results, significance, and more — seven facets brought into focus.
Impact
Paper Details
Authors
PDF Preview
Key Terms
Citation Network
Current paper (gray), citations (green), references (blue)
Display is limited for performance on very large graphs.
Discussion 0