survivalContour: Visualizing predicted survival via colored contour plots
Publication
Metrics
AI Quick Summary
The paper introduces "survivalContour," a method using colored contour plots to visually represent predicted survival probabilities over time, addressing the gap in graphical tools for continuous covariates. It provides a Shiny app and R package for implementation, supporting traditional models like Cox and Fine-Gray, and particularly enhancing machine learning models like random survival forests and deep neural networks.
Paper Preview
Abstract
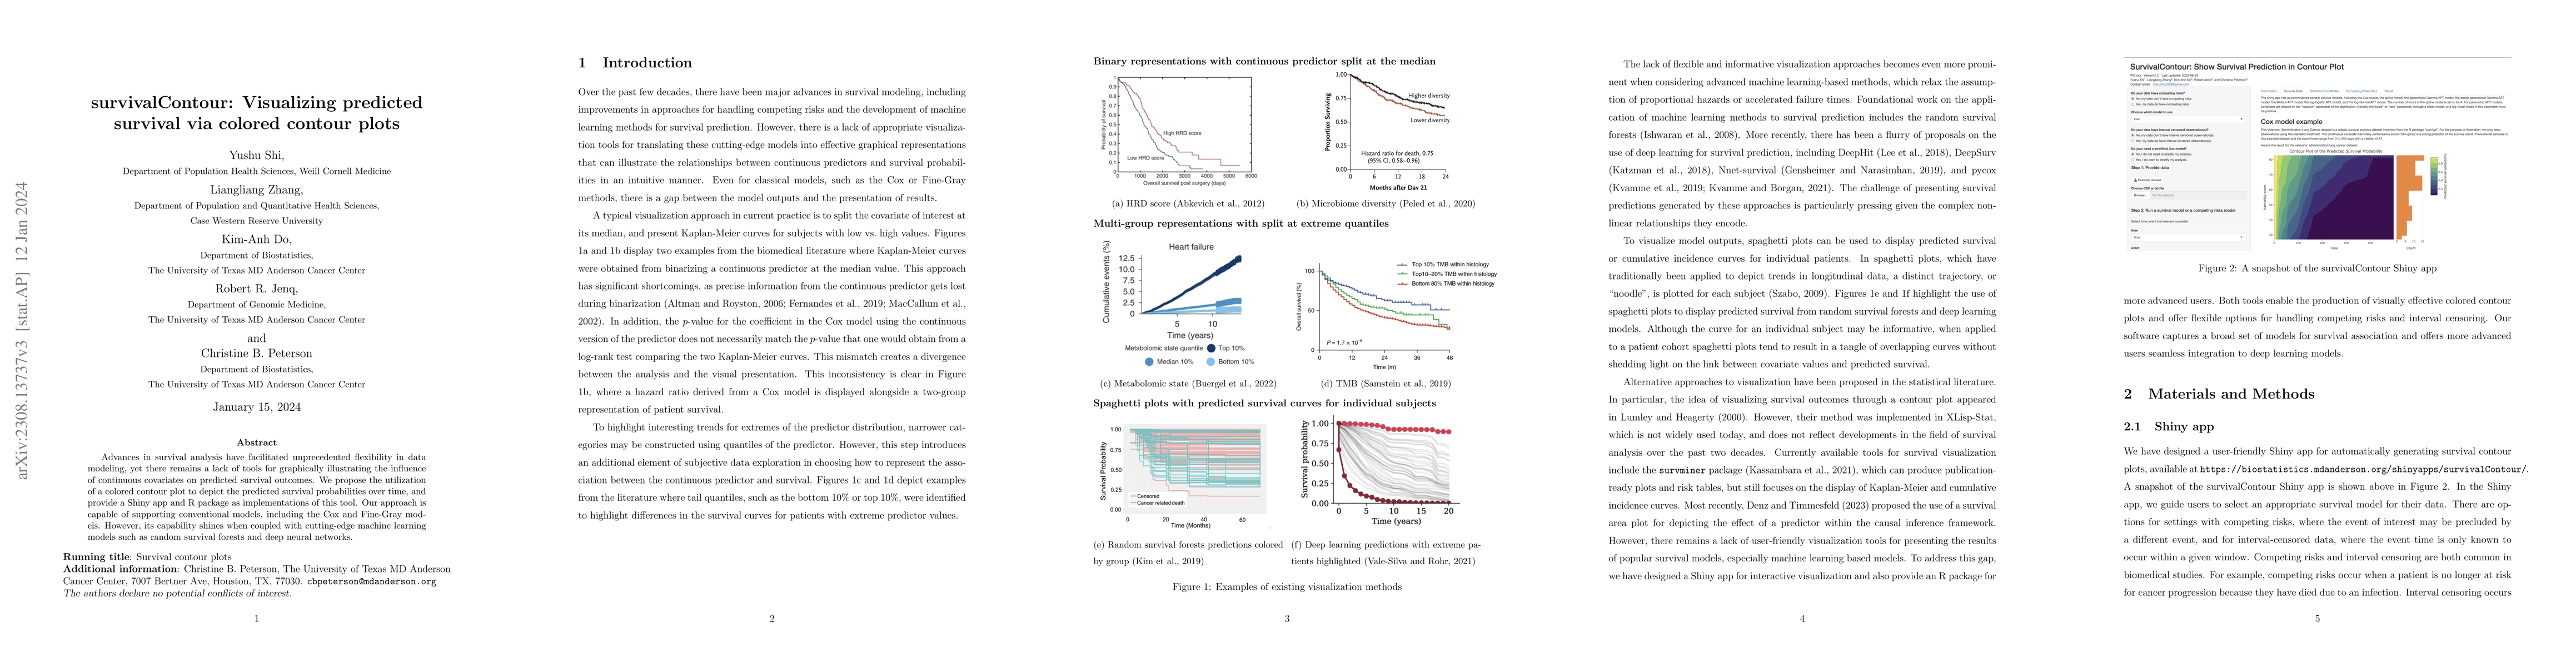
Advances in survival analysis have facilitated unprecedented flexibility in data modeling, yet there remains a lack of tools for graphically illustrating the influence of continuous covariates on predicted survival outcomes. We propose the utilization of a colored contour plot to depict the predicted survival probabilities over time, and provide a Shiny app and R package as implementations of this tool. Our approach is capable of supporting conventional models, including the Cox and Fine-Gray models. However, its capability shines when coupled with cutting-edge machine learning models such as random survival forests and deep neural networks.
AI Key Findings
Get AI-generated insights about this paper's methodology, results, significance, and more — seven facets brought into focus.
Impact
Paper Details
Authors
PDF Preview
Key Terms
Citation Network
Current paper (gray), citations (green), references (blue)
Display is limited for performance on very large graphs.
Discussion 0