Publication
Metrics
AI Quick Summary
This paper illustrates how to graphically understand slope limiter using bounding lines on a mesh, generalizing it from uniform to non-uniform meshes for high-resolution total variance diminishing results.
Paper Preview
Abstract
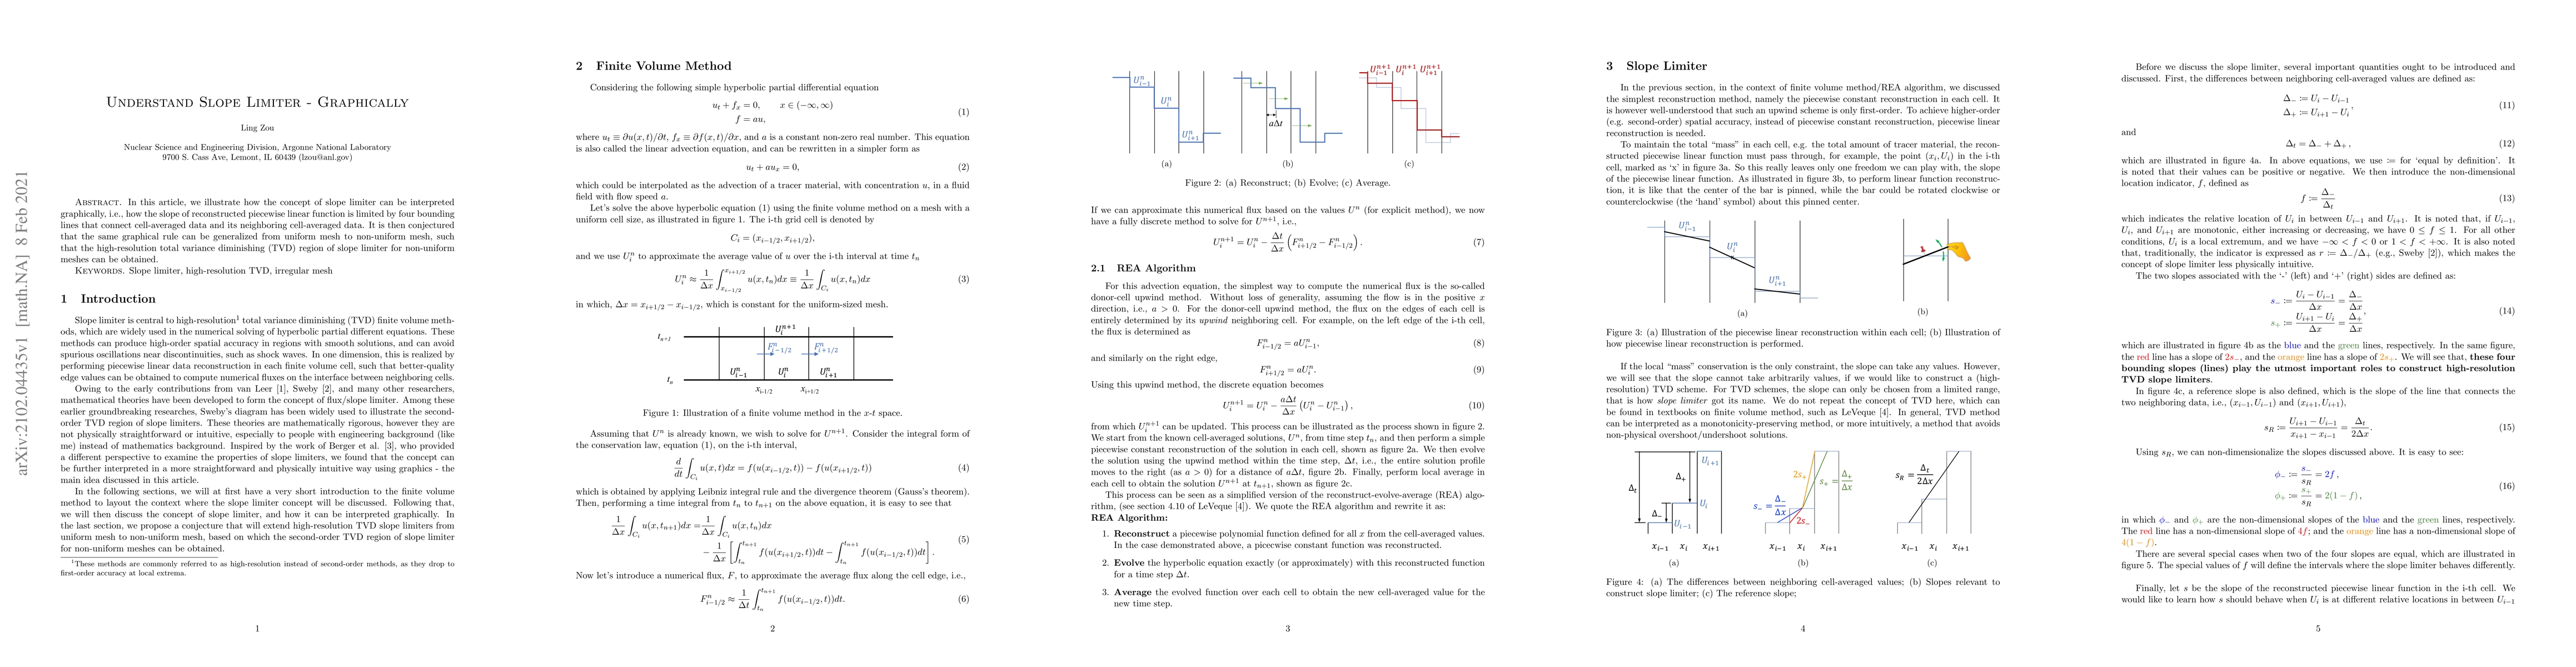
In this article, we illustrate how the concept of slope limiter can be interpreted graphically, i.e., how the slope of reconstructed piecewise linear function is limited by four bounding lines that connect cell-averaged data and its neighboring cell-averaged data. It is then conjectured that the same graphical rule can be generalized from uniform mesh to non-uniform mesh, such that the high-resolution total variance diminishing (TVD) region of slope limiter for non-uniform meshes can be obtained.
OpenAlex
- Citations in OpenAlex
- 2
- Publication year
- 2021
- Access status
- Open access
Source: OpenAlex · Snapshot
AI Key Findings
Get AI-generated insights about this paper's methodology, results, significance, and more — seven facets brought into focus.
Impact
Paper Details
Authors
PDF Preview
Key Terms
Citation Network
Current paper (gray), citations (green), references (blue)
Display is limited for performance on very large graphs.
Discussion 0