Using Graphlet Spectrograms for Temporal Pattern Analysis of Virus-Research Collaboration Networks
Publication
Metrics
AI Quick Summary
Researchers developed a new method to analyze collaboration networks in virus research, using graphlet spectrograms to identify patterns and structures over time. The study revealed unique roles of bi-fork graphlets in detecting bridges and quantifying grassroots collaborations.
Paper Preview
Abstract
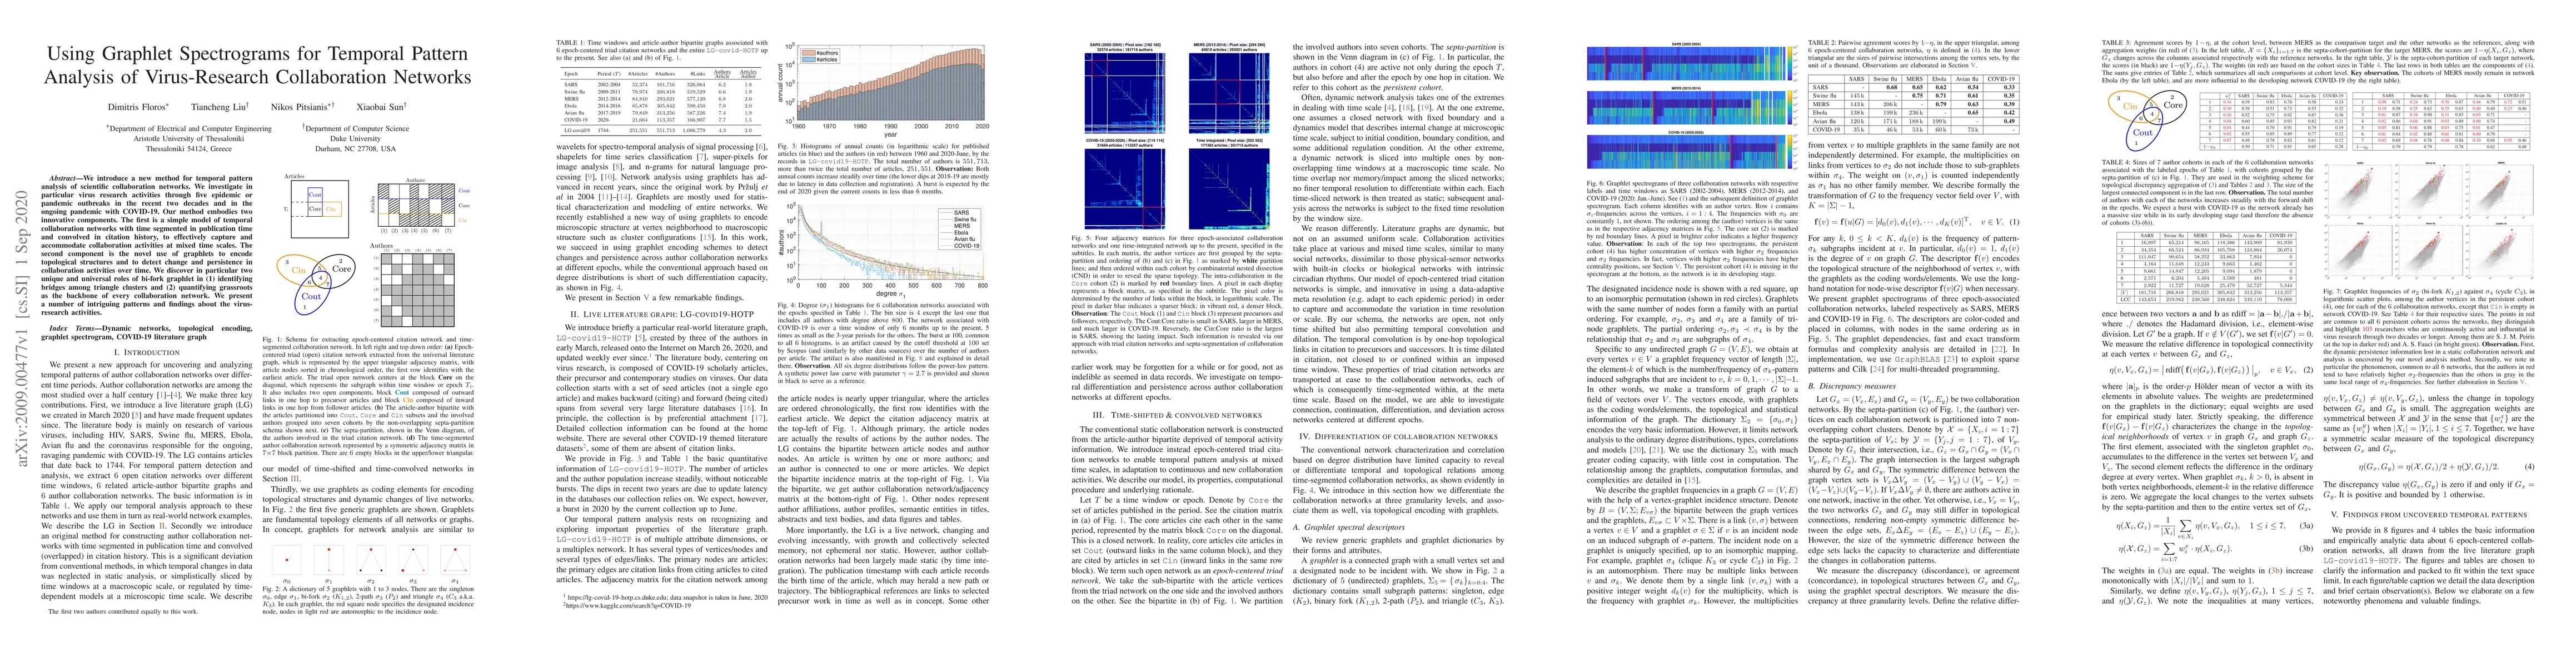
We introduce a new method for temporal pattern analysis of scientific collaboration networks. We investigate in particular virus research activities through five epidemic or pandemic outbreaks in the recent two decades and in the ongoing pandemic with COVID-19. Our method embodies two innovative components. The first is a simple model of temporal collaboration networks with time segmented in publication time and convolved in citation history, to effectively capture and accommodate collaboration activities at mixed time scales. The second component is the novel use of graphlets to encode topological structures and to detect change and persistence in collaboration activities over time. We discover in particular two unique and universal roles of bi-fork graphlet in (1) identifying bridges among triangle clusters and (2) quantifying grassroots as the backbone of every collaboration network. We present a number of intriguing patterns and findings about the virus-research activities.
AI Key Findings
Get AI-generated insights about this paper's methodology, results, significance, and more — seven facets brought into focus.
Impact
Paper Details
Authors
PDF Preview
Key Terms
Citation Network
Current paper (gray), citations (green), references (blue)
Display is limited for performance on very large graphs.
Discussion 0