ViDaExpert: user-friendly tool for nonlinear visualization and analysis of multidimensional vectorial data
Publication
Metrics
AI Quick Summary
ViDaExpert is a user-friendly tool for visualizing and analyzing multidimensional vectorial data, offering statistical methods like PCA, LDA, and K-Means clustering, along with interactive 3D visualizations and customizable data point representations. It facilitates quick and insightful statistical analysis through its intuitive interface.
Paper Preview
Abstract
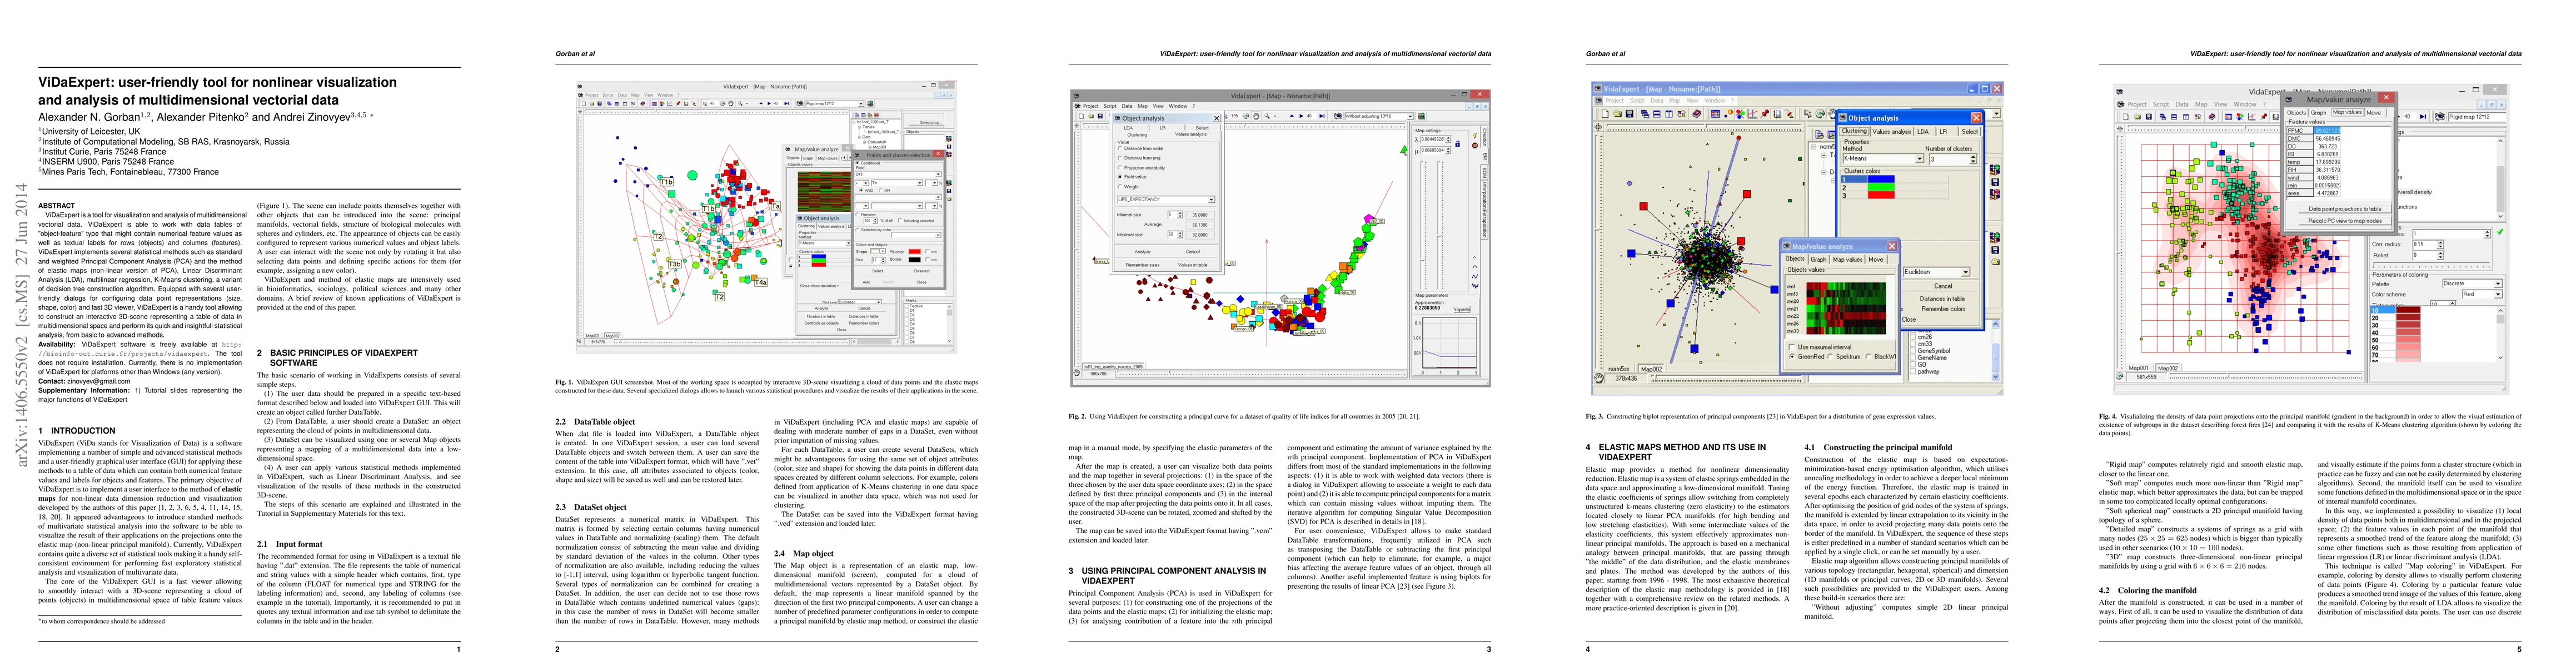
ViDaExpert is a tool for visualization and analysis of multidimensional vectorial data. ViDaExpert is able to work with data tables of "object-feature" type that might contain numerical feature values as well as textual labels for rows (objects) and columns (features). ViDaExpert implements several statistical methods such as standard and weighted Principal Component Analysis (PCA) and the method of elastic maps (non-linear version of PCA), Linear Discriminant Analysis (LDA), multilinear regression, K-Means clustering, a variant of decision tree construction algorithm. Equipped with several user-friendly dialogs for configuring data point representations (size, shape, color) and fast 3D viewer, ViDaExpert is a handy tool allowing to construct an interactive 3D-scene representing a table of data in multidimensional space and perform its quick and insightfull statistical analysis, from basic to advanced methods.
AI Key Findings
Get AI-generated insights about this paper's methodology, results, significance, and more — seven facets brought into focus.
Impact
Paper Details
PDF Preview
Key Terms
Citation Network
Current paper (gray), citations (green), references (blue)
Display is limited for performance on very large graphs.
Discussion 0