visTree: Visualization of Subgroups for a Decision Tree
Publication
Metrics
Paper Preview
Abstract
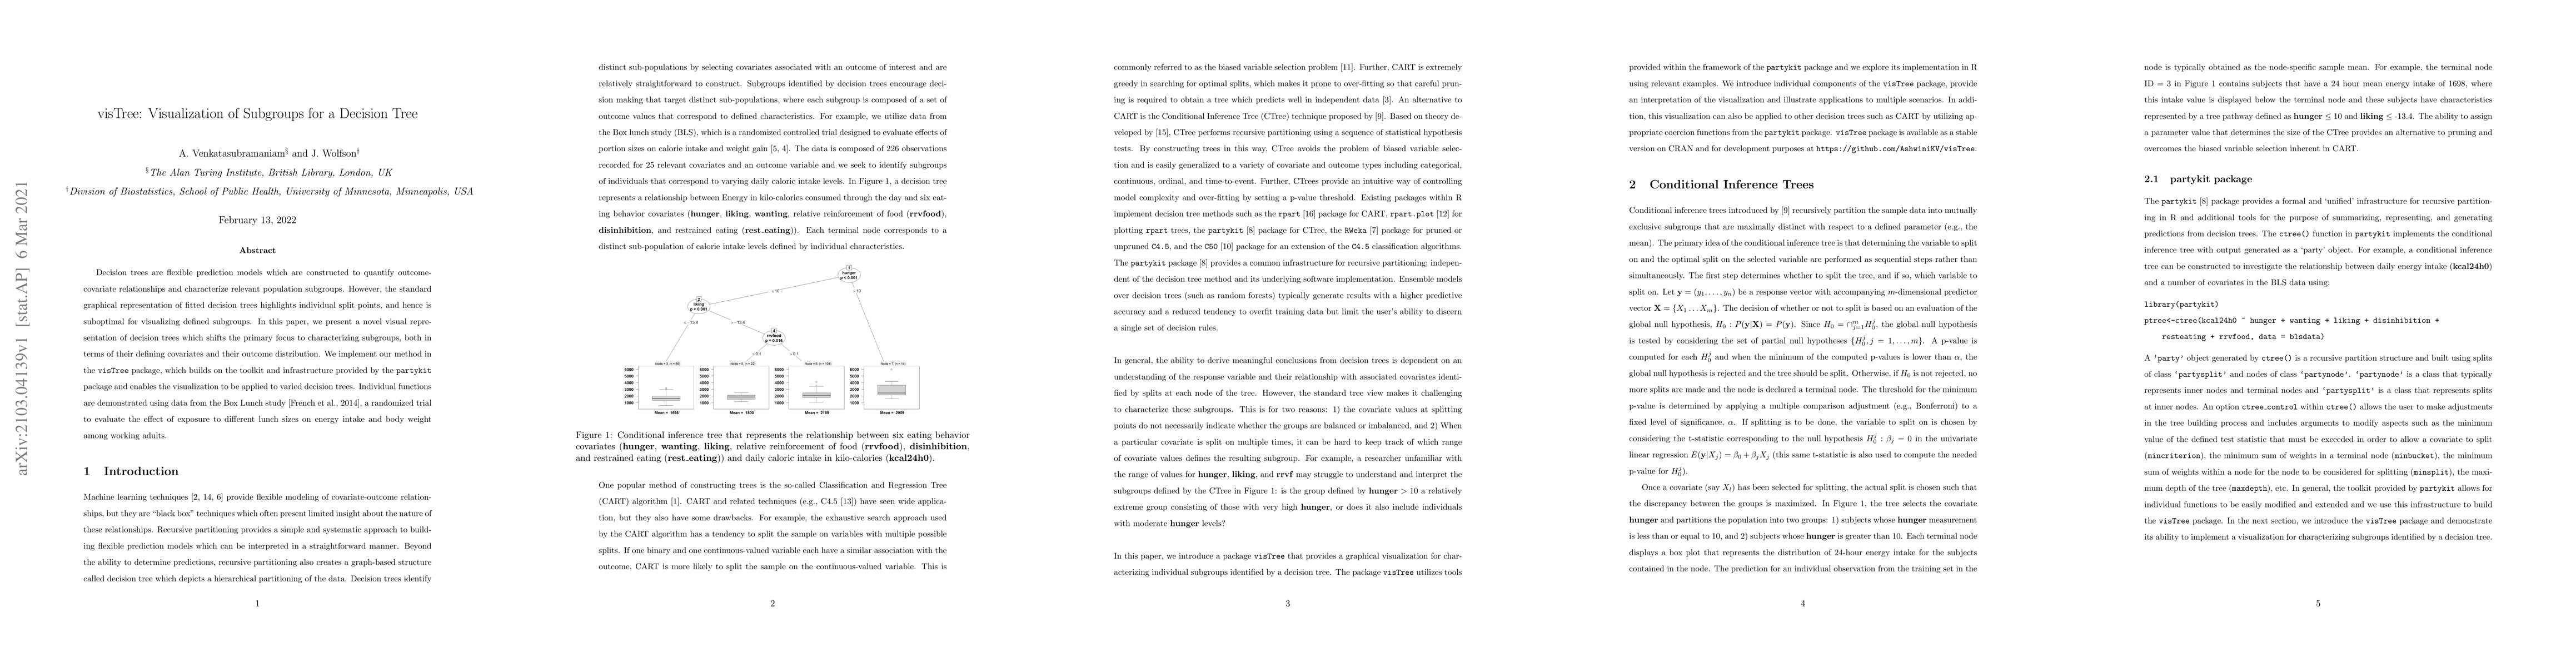
Decision trees are flexible prediction models which are constructed to quantify outcome-covariate relationships and characterize relevant population subgroups. However, the standard graphical representation of fitted decision trees highlights individual split points, and hence is suboptimal for visualizing defined subgroups. In this paper, we present a novel visual representation of decision trees which shifts the primary focus to characterizing subgroups, both in terms of their defining covariates and their outcome distribution. We implement our method in the \texttt{visTree} package, which builds on the toolkit and infrastructure provided by the \texttt{partykit} package and enables the visualization to be applied to varied decision trees. Individual functions are demonstrated using data from the Box Lunch study [French et al., 2014], a randomized trial to evaluate the effect of exposure to different lunch sizes on energy intake and body weight among working adults.
AI Key Findings
Get AI-generated insights about this paper's methodology, results, significance, and more — seven facets brought into focus.
Impact
Paper Details
Authors
PDF Preview
Key Terms
Citation Network
Current paper (gray), citations (green), references (blue)
Display is limited for performance on very large graphs.
Discussion 0