Publication
Metrics
AI Quick Summary
Researchers developed a visual analytics method for set data to support knowledge discovery and member selection, using a manifold network model to visualize relevant factors as topographic maps.
Paper Preview
Abstract
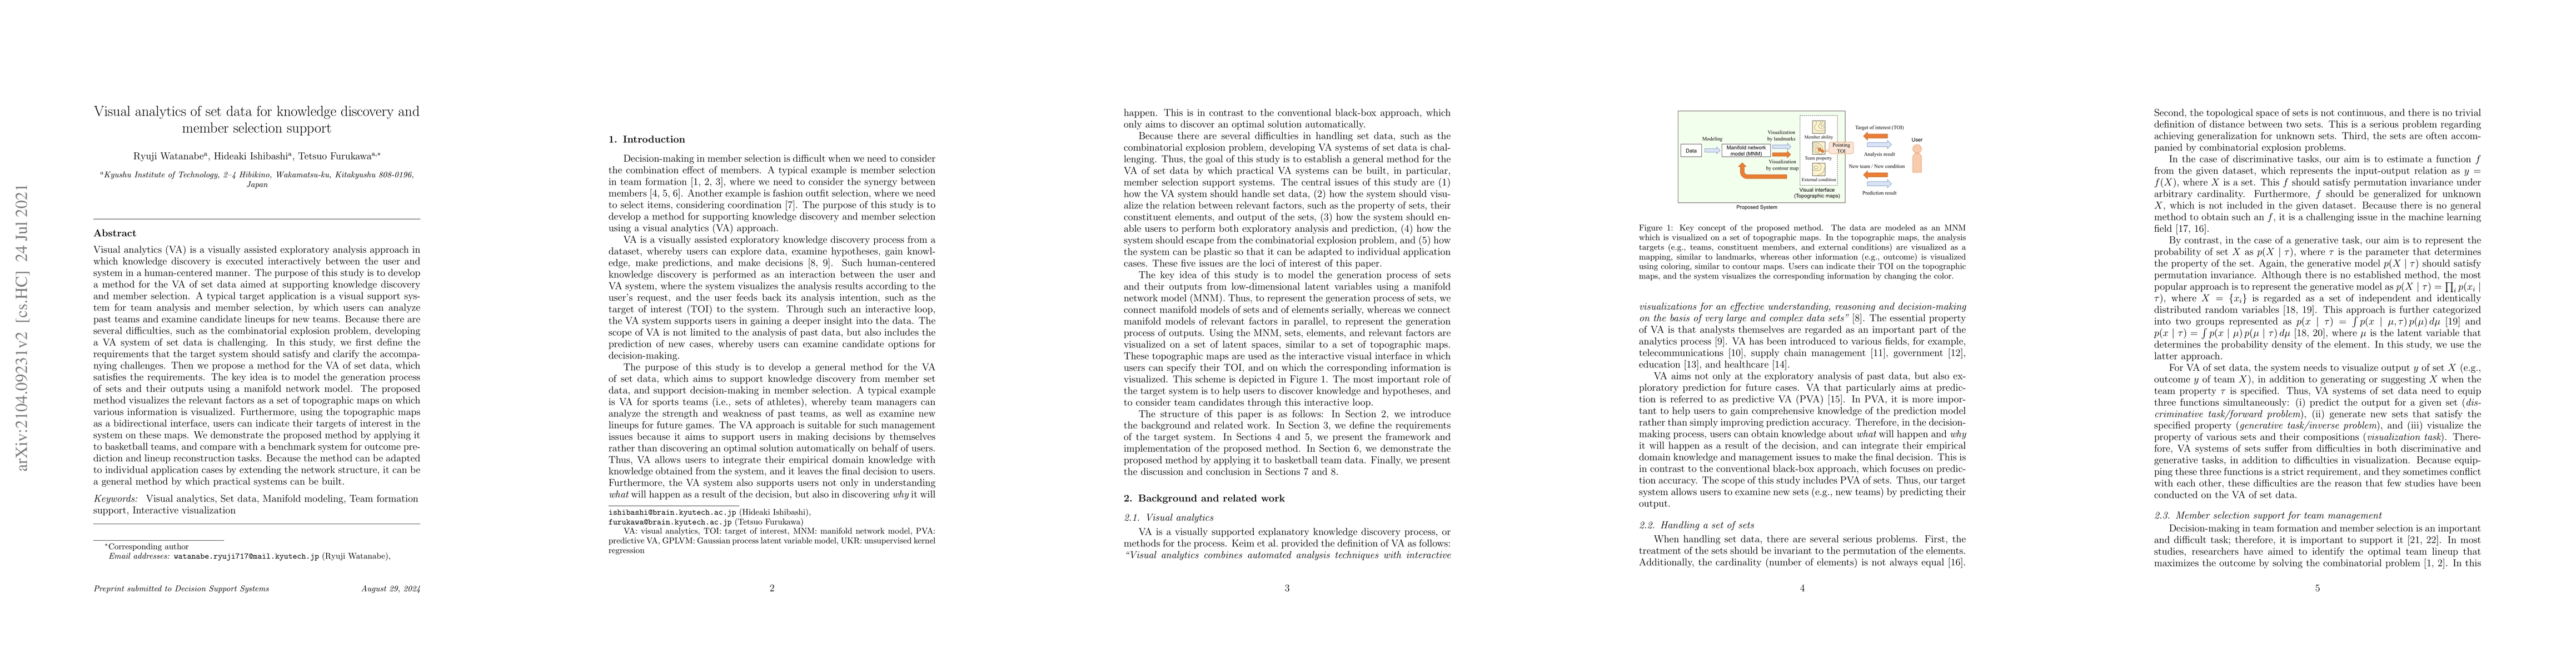
Visual analytics (VA) is a visually assisted exploratory analysis approach in which knowledge discovery is executed interactively between the user and system in a human-centered manner. The purpose of this study is to develop a method for the VA of set data aimed at supporting knowledge discovery and member selection. A typical target application is a visual support system for team analysis and member selection, by which users can analyze past teams and examine candidate lineups for new teams. Because there are several difficulties, such as the combinatorial explosion problem, developing a VA system of set data is challenging. In this study, we first define the requirements that the target system should satisfy and clarify the accompanying challenges. Then we propose a method for the VA of set data, which satisfies the requirements. The key idea is to model the generation process of sets and their outputs using a manifold network model. The proposed method visualizes the relevant factors as a set of topographic maps on which various information is visualized. Furthermore, using the topographic maps as a bidirectional interface, users can indicate their targets of interest in the system on these maps. We demonstrate the proposed method by applying it to basketball teams, and compare with a benchmark system for outcome prediction and lineup reconstruction tasks. Because the method can be adapted to individual application cases by extending the network structure, it can be a general method by which practical systems can be built.
AI Key Findings
Get AI-generated insights about this paper's methodology, results, significance, and more — seven facets brought into focus.
Impact
Paper Details
PDF Preview
Key Terms
Citation Network
Current paper (gray), citations (green), references (blue)
Display is limited for performance on very large graphs.
Discussion 0