01
MethodologyHow they did it
Rootogram visualization was used to analyze count data with varying dispersion.
Rootogram visualization was used to analyze count data with varying dispersion. More in Methodology →
The rootogram revealed underdispersion in the Poisson model. — Hurdle Poisson regression captured the few zeros and led to a satisfactory fit. More in Key Results →
This research highlights the importance of accounting for dispersion in count data models. More in Significance →
The analysis assumes that the data follows a Poisson distribution. — The rootogram visualization may not be suitable for all types of count data. More in Limitations →
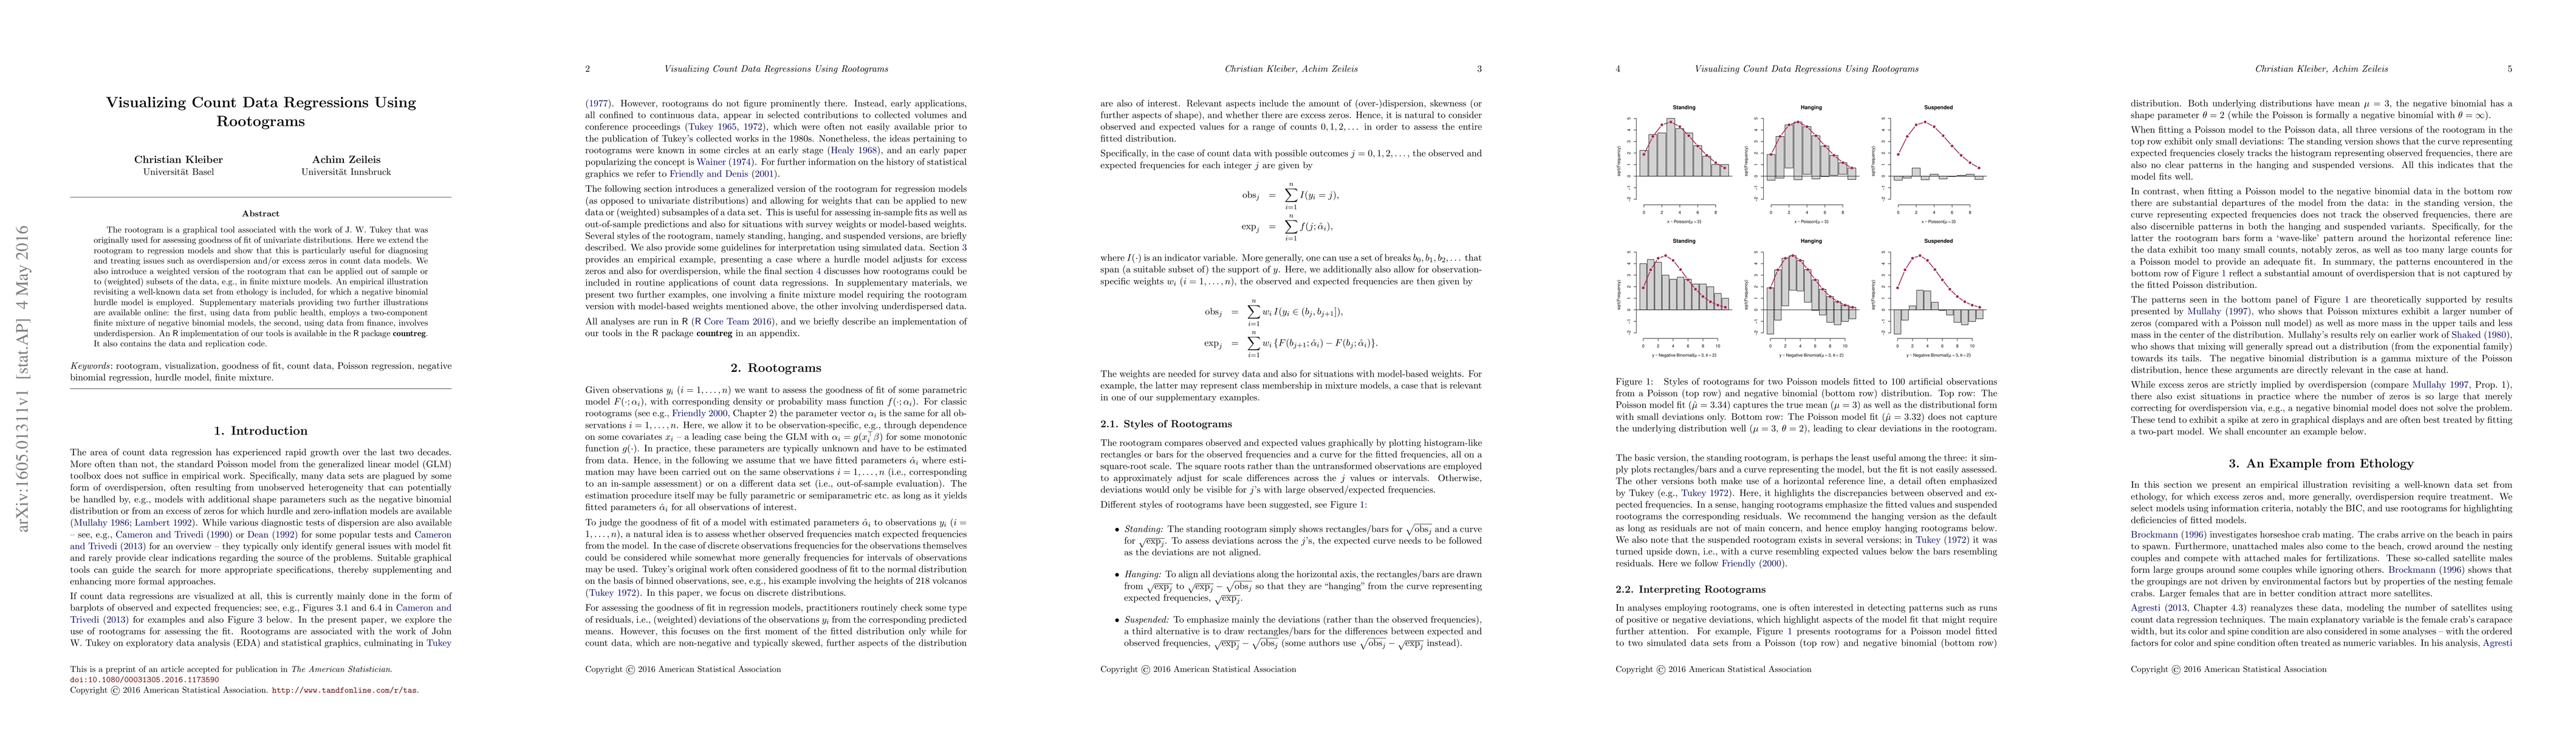
The rootogram is a graphical tool associated with the work of J. W. Tukey that was originally used for assessing goodness of fit of univariate distributions. Here we extend the rootogram to regression models and show that this is particularly useful for diagnosing and treating issues such as overdispersion and/or excess zeros in count data models. We also introduce a weighted version of the rootogram that can be applied out of sample or to (weighted) subsets of the data, e.g., in finite mixture models. An empirical illustration revisiting a well-known data set from ethology is included, for which a negative binomial hurdle model is employed. Supplementary materials providing two further illustrations are available online: the first, using data from public health, employs a two-component finite mixture of negative binomial models, the second, using data from finance, involves underdispersion. An R implementation of our tools is available in the R package countreg. It also contains the data and replication code.
Seven facets of this paper, analysed and brought into focus by AI.
This research highlights the importance of accounting for dispersion in count data models.
Rootogram visualization was used to analyze count data with varying dispersion.
This research highlights the importance of accounting for dispersion in count data models.
The use of rootogram visualization to analyze count data with varying dispersion is a novel contribution.
This research demonstrates the value of using rootograms to detect underdispersion in count data models.
Current paper (gray), citations (green), references (blue)
Display is limited for performance on very large graphs.
Discussion 0