A geometric analysis of nonlinear dynamics and its application to financial time series
Publication
Metrics
AI Quick Summary
This research introduces a geometric method to study nonlinear oscillations, like financial time series, without needing the exact function form. It transforms differential equations into a 3D curve analysis, using nonparametric filtering to estimate dynamic properties. Applied to Japanese stock price index data, it reveals vector field and derivative tools for understanding market dynamics.
Paper Preview
Abstract
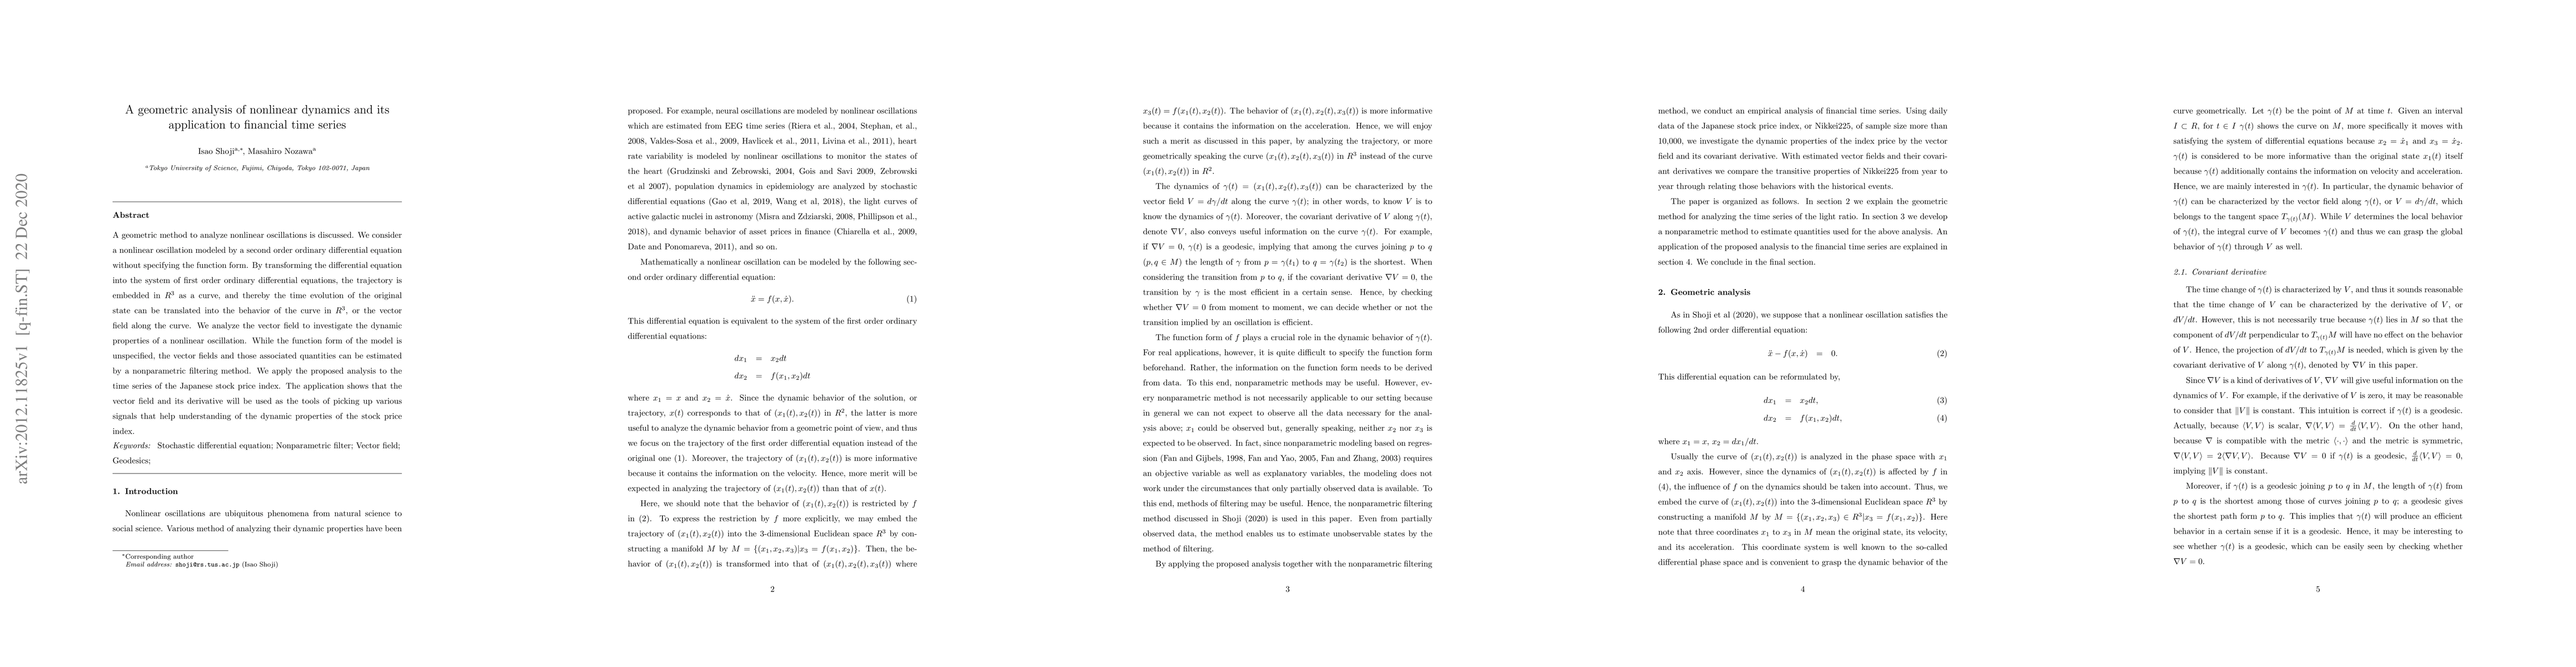
A geometric method to analyze nonlinear oscillations is discussed. We consider a nonlinear oscillation modeled by a second order ordinary differential equation without specifying the function form. By transforming the differential equation into the system of first order ordinary differential equations, the trajectory is embedded in $R^3$ as a curve, and thereby the time evolution of the original state can be translated into the behavior of the curve in $R^3$, or the vector field along the curve. We analyze the vector field to investigate the dynamic properties of a nonlinear oscillation. While the function form of the model is unspecified, the vector fields and those associated quantities can be estimated by a nonparametric filtering method. We apply the proposed analysis to the time series of the Japanese stock price index. The application shows that the vector field and its derivative will be used as the tools of picking up various signals that help understanding of the dynamic properties of the stock price index.
AI Key Findings
Get AI-generated insights about this paper's methodology, results, significance, and more — seven facets brought into focus.
Impact
Paper Details
Authors
PDF Preview
Key Terms
Citation Network
Current paper (gray), citations (green), references (blue)
Display is limited for performance on very large graphs.
Discussion 0