Alternatives to Contour Visualizations for Power Systems Data
Publication
Metrics
AI Quick Summary
This paper explores alternatives to traditional contour maps for visualizing voltage data in power systems, evaluating Voronoi polygons, H3 tessellations, S2 tessellations, and network-weighted contour maps. The study finds that Voronoi tessellations and network-weighted contour maps provide more accurate representations of voltage data compared to regular contour maps.
Paper Preview
Abstract
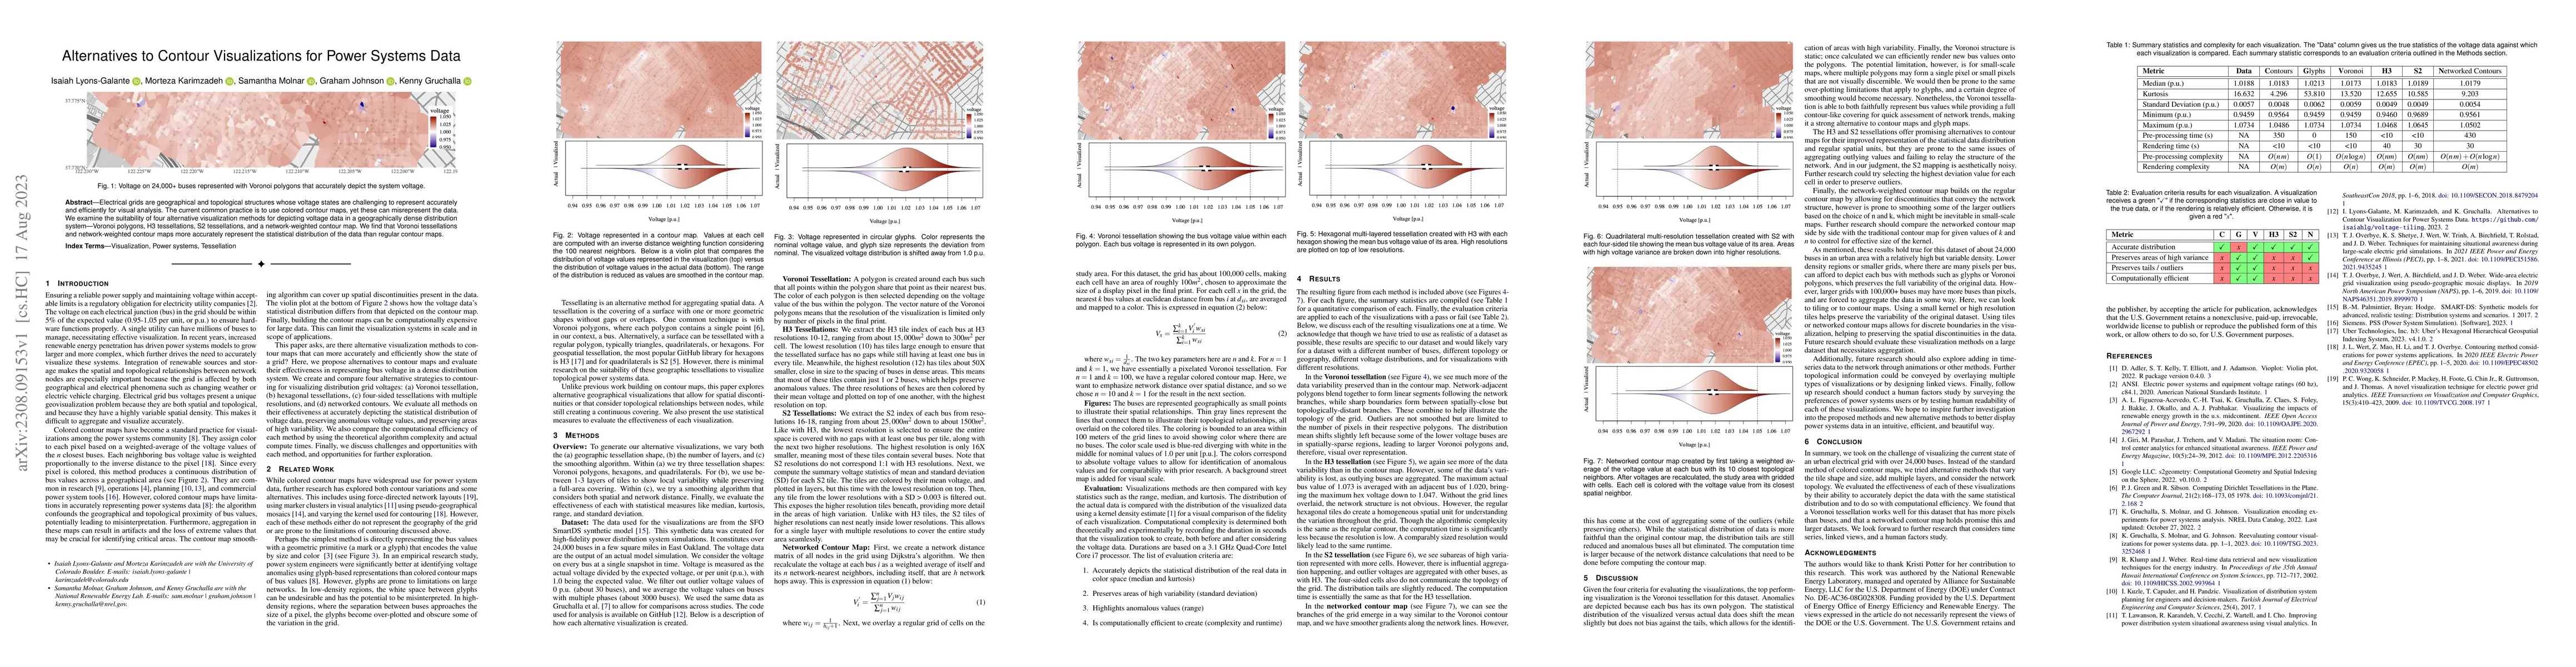
Electrical grids are geographical and topological structures whose voltage states are challenging to represent accurately and efficiently for visual analysis. The current common practice is to use colored contour maps, yet these can misrepresent the data. We examine the suitability of four alternative visualization methods for depicting voltage data in a geographically dense distribution system -- Voronoi polygons, H3 tessellations, S2 tessellations, and a network-weighted contour map. We find that Voronoi tessellations and network-weighted contour maps more accurately represent the statistical distribution of the data than regular contour maps.
AI Key Findings
Get AI-generated insights about this paper's methodology, results, significance, and more — seven facets brought into focus.
Impact
Paper Details
Authors
PDF Preview
Key Terms
Citation Network
Current paper (gray), citations (green), references (blue)
Display is limited for performance on very large graphs.
Discussion 0