An Analytical Survey on Recent Trends in High Dimensional Data Visualization
Publication
Metrics
AI Quick Summary
This paper surveys high-dimensional data visualization techniques, analyzing their performance through runtime, memory usage, and structural preservation metrics. It highlights the strengths and limitations of selected state-of-the-art methods, revealing their suitability for specific tasks and constraints imposed by compute resources.
Paper Preview
Abstract
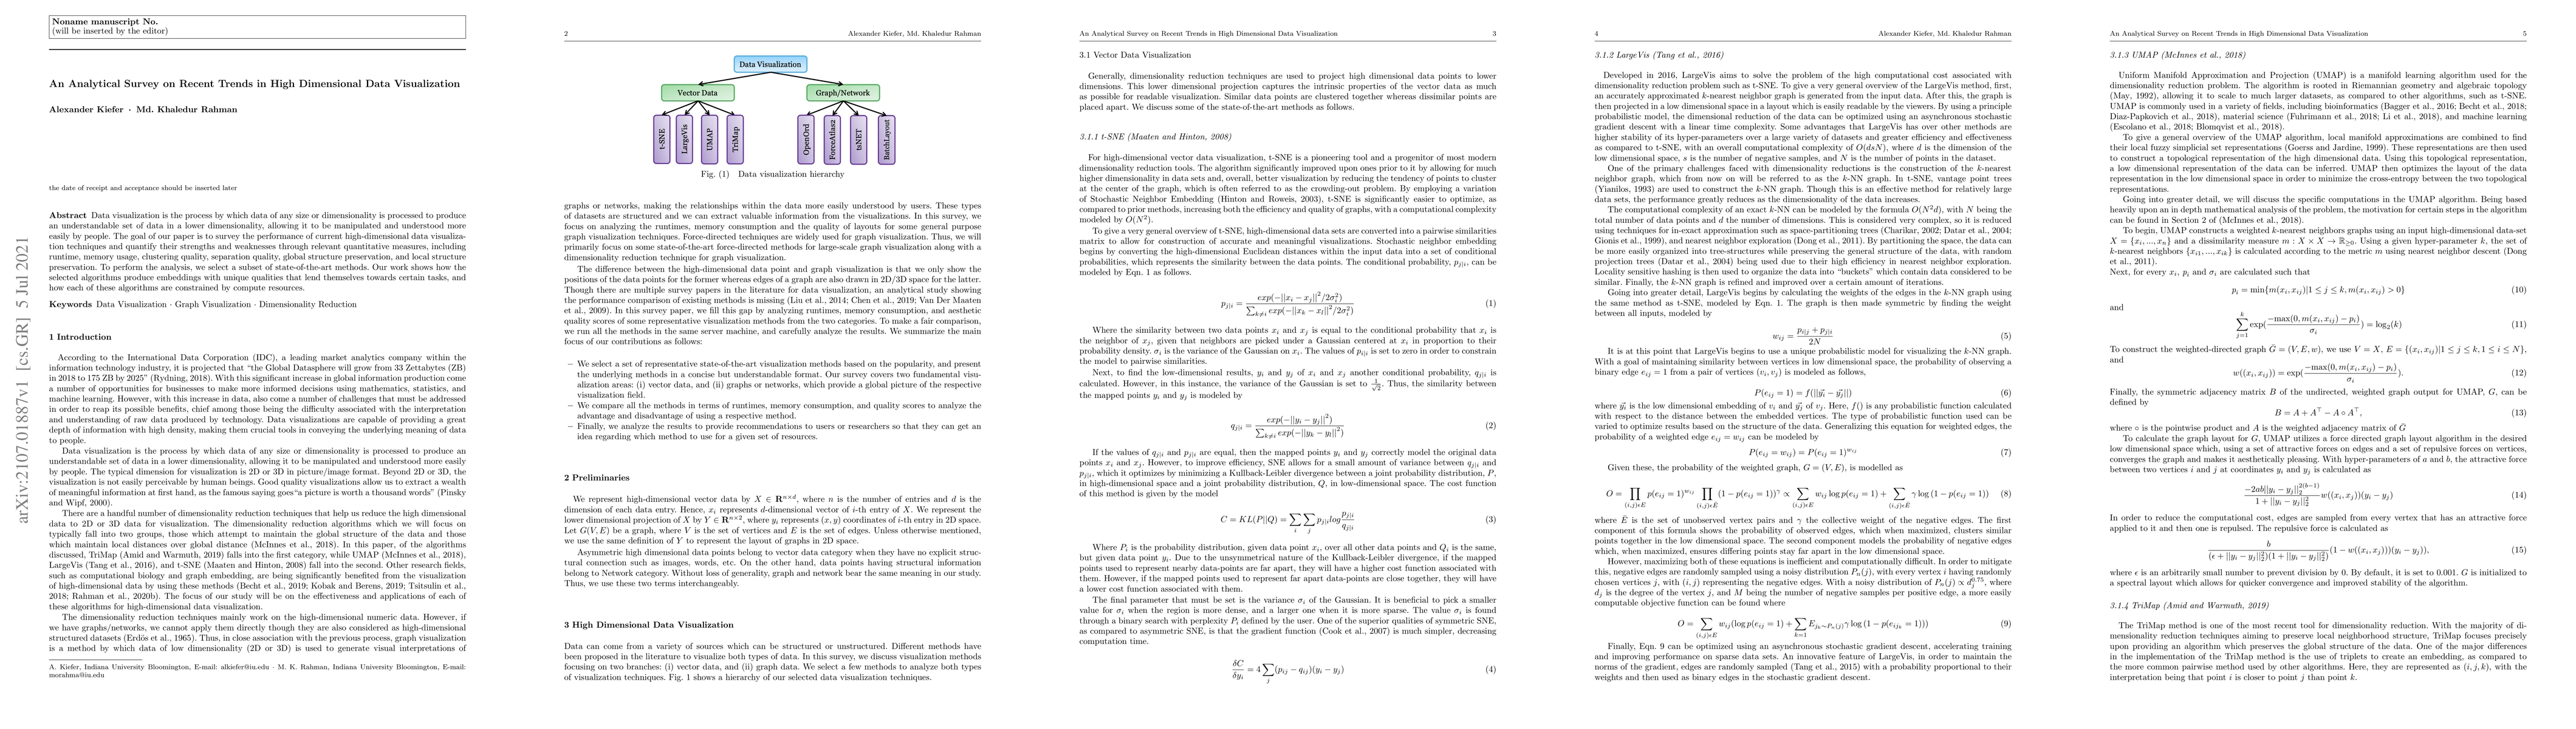
Data visualization is the process by which data of any size or dimensionality is processed to produce an understandable set of data in a lower dimensionality, allowing it to be manipulated and understood more easily by people. The goal of our paper is to survey the performance of current high-dimensional data visualization techniques and quantify their strengths and weaknesses through relevant quantitative measures, including runtime, memory usage, clustering quality, separation quality, global structure preservation, and local structure preservation. To perform the analysis, we select a subset of state-of-the-art methods. Our work shows how the selected algorithms produce embeddings with unique qualities that lend themselves towards certain tasks, and how each of these algorithms are constrained by compute resources.
AI Key Findings
Get AI-generated insights about this paper's methodology, results, significance, and more — seven facets brought into focus.
Impact
Paper Details
Authors
PDF Preview
Key Terms
Citation Network
Current paper (gray), citations (green), references (blue)
Display is limited for performance on very large graphs.
Discussion 0