An Empirical Approach to Financial Crisis Indicators Based on Random Matrices
Publication
Metrics
AI Quick Summary
This paper develops financial crisis indicators using the spectral properties of market data's covariance and correlation matrices derived from random matrix theory. The indicators, based on Hellinger distance and spectral radius, aim to predict crises by detecting deviations in eigenvalue distributions and market volatility.
Paper Preview
Abstract
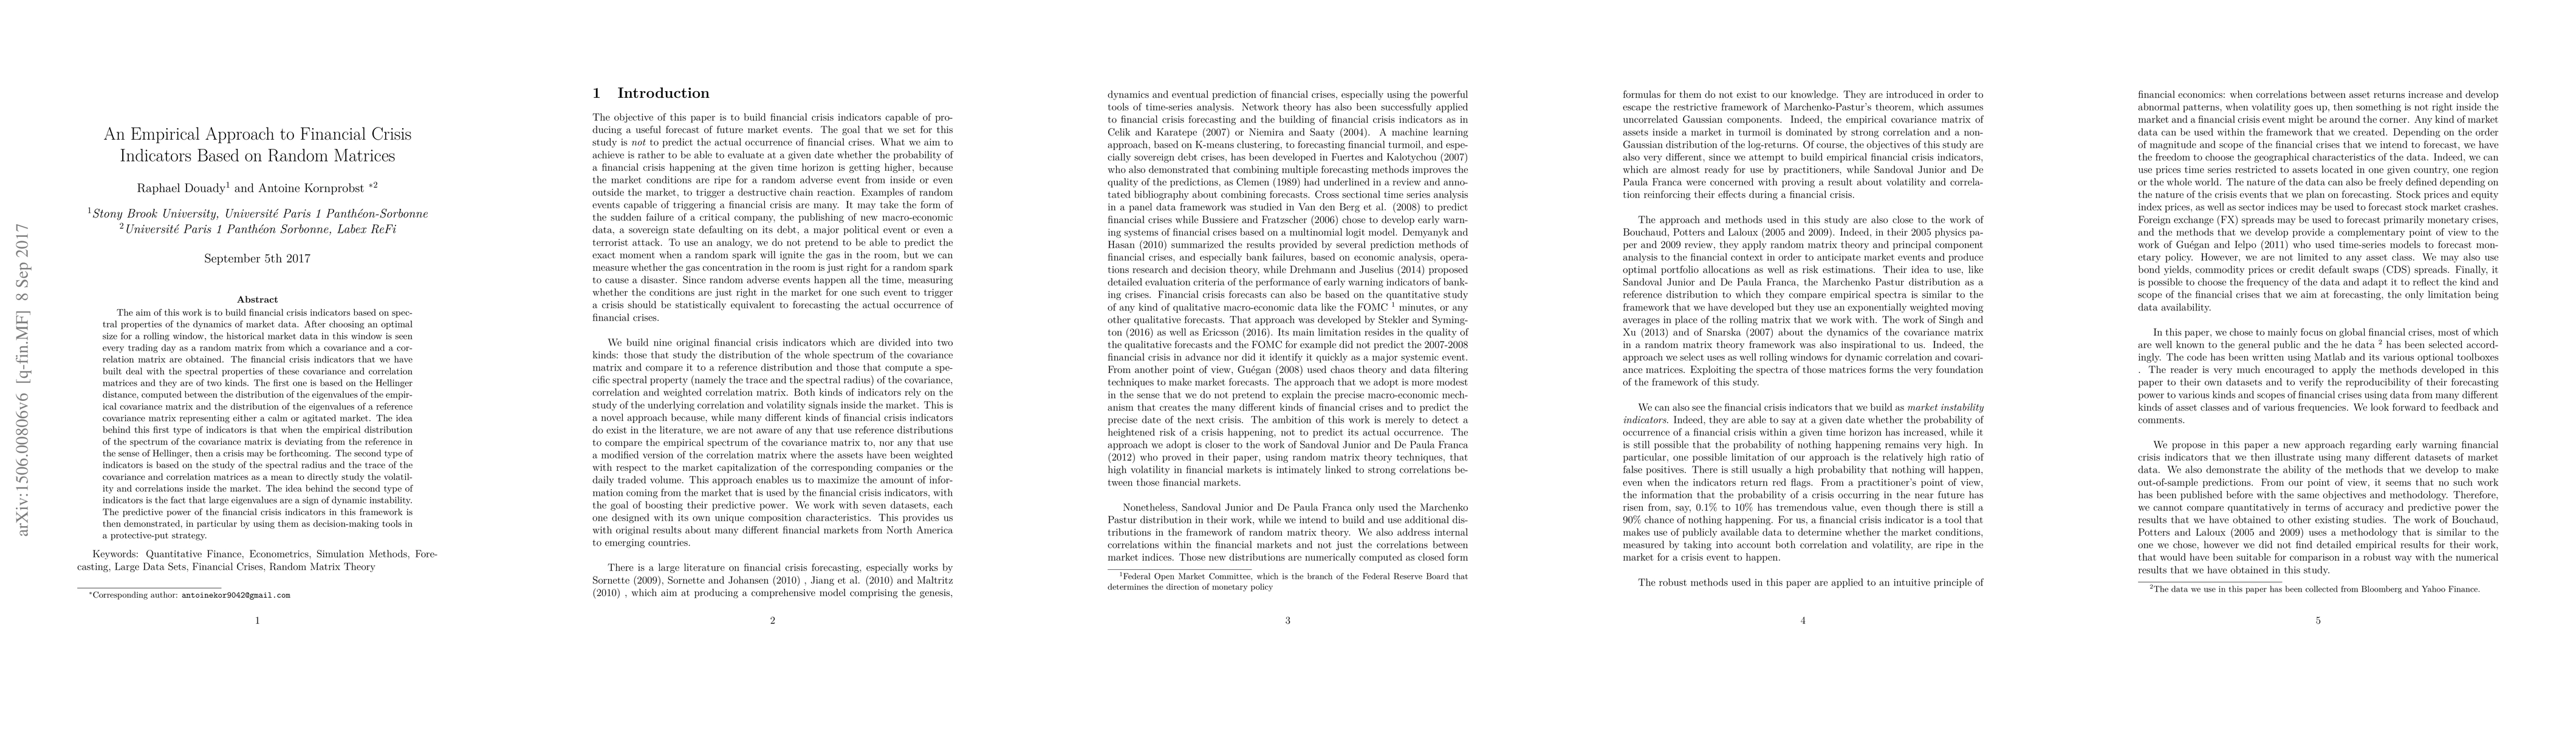
The aim of this work is to build financial crisis indicators based on spectral properties of the dynamics of market data. After choosing an optimal size for a rolling window, the historical market data in this window is seen every trading day as a random matrix from which a covariance and a correlation matrix are obtained. The financial crisis indicators that we have built deal with the spectral properties of these covariance and correlation matrices and they are of two kinds. The first one is based on the Hellinger distance, computed between the distribution of the eigenvalues of the empirical covariance matrix and the distribution of the eigenvalues of a reference covariance matrix representing either a calm or agitated market. The idea behind this first type of indicators is that when the empirical distribution of the spectrum of the covariance matrix is deviating from the reference in the sense of Hellinger, then a crisis may be forthcoming. The second type of indicators is based on the study of the spectral radius and the trace of the covariance and correlation matrices as a mean to directly study the volatility and correlations inside the market. The idea behind the second type of indicators is the fact that large eigenvalues are a sign of dynamic instability. The predictive power of the financial crisis indicators in this framework is then demonstrated, in particular by using them as decision-making tools in a protective-put strategy.
AI Key Findings
Get AI-generated insights about this paper's methodology, results, significance, and more — seven facets brought into focus.
Impact
Paper Details
PDF Preview
Key Terms
Citation Network
Current paper (gray), citations (green), references (blue)
Display is limited for performance on very large graphs.
Discussion 0