An extensible point-based method for data chart value detection
Publication
Metrics
AI Quick Summary
This paper introduces an extensible point-based method using a point proposal network to detect semantic points in scientific data charts, achieving high accuracy on both real and synthetic charts. The method shows promising results when trained on synthetic data, demonstrating its adaptability to various chart types.
Paper Preview
Abstract
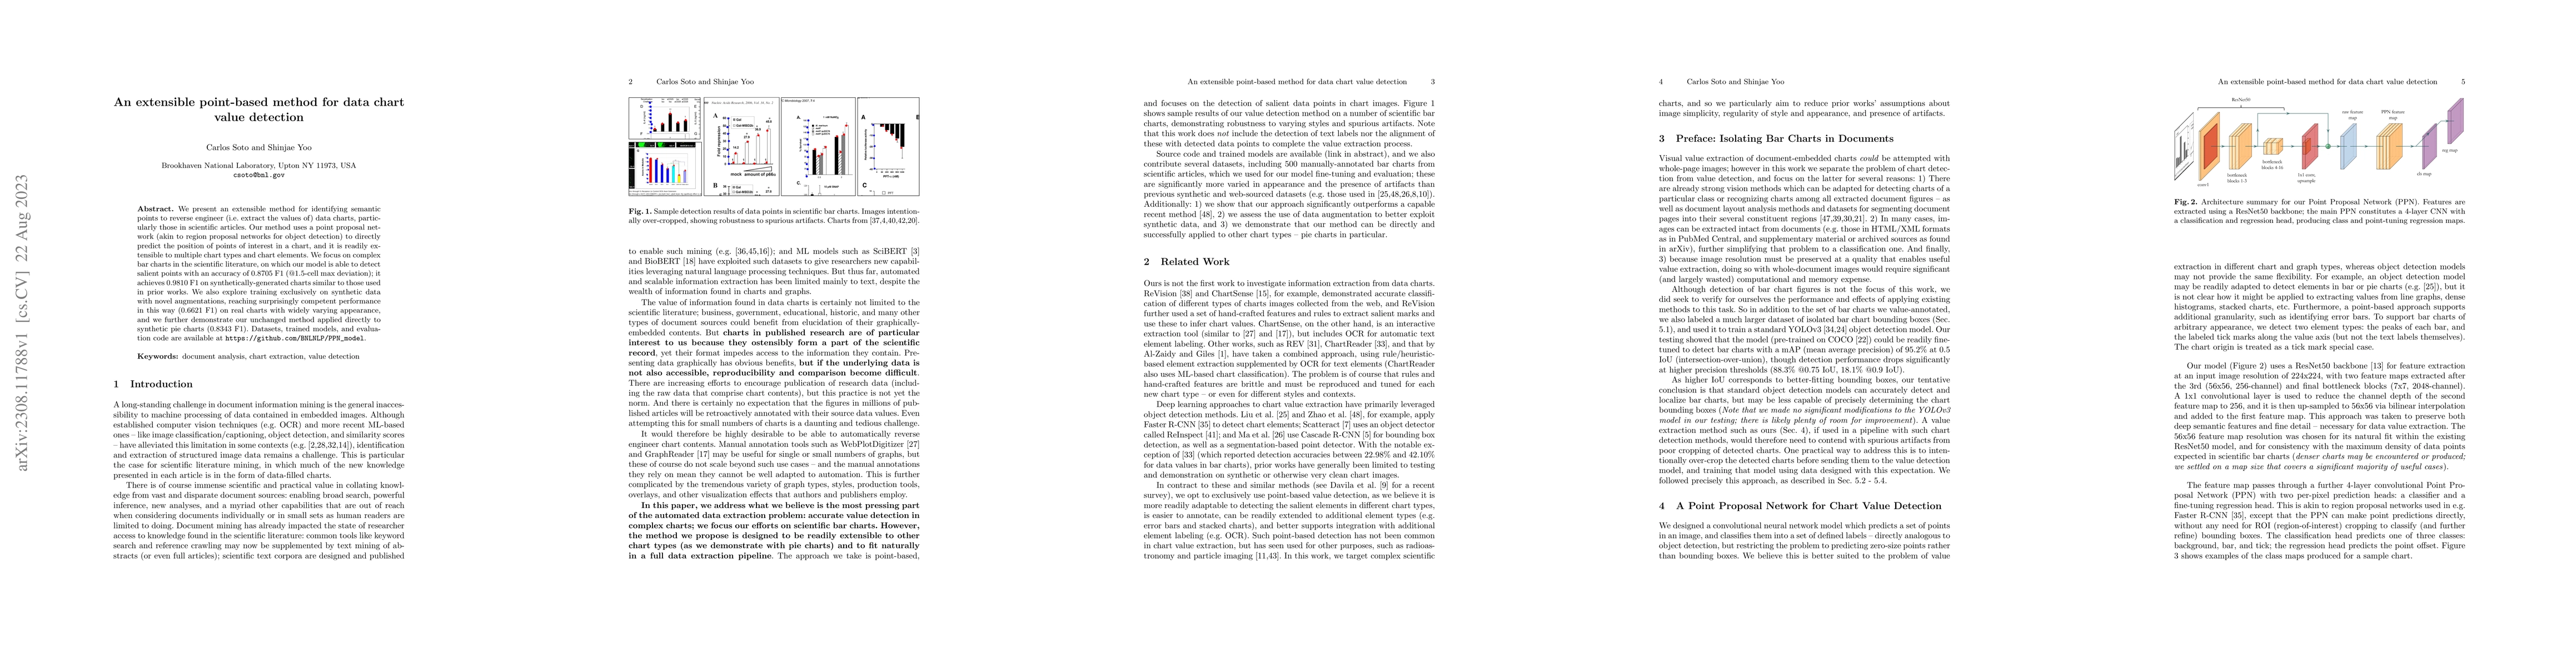
We present an extensible method for identifying semantic points to reverse engineer (i.e. extract the values of) data charts, particularly those in scientific articles. Our method uses a point proposal network (akin to region proposal networks for object detection) to directly predict the position of points of interest in a chart, and it is readily extensible to multiple chart types and chart elements. We focus on complex bar charts in the scientific literature, on which our model is able to detect salient points with an accuracy of 0.8705 F1 (@1.5-cell max deviation); it achieves 0.9810 F1 on synthetically-generated charts similar to those used in prior works. We also explore training exclusively on synthetic data with novel augmentations, reaching surprisingly competent performance in this way (0.6621 F1) on real charts with widely varying appearance, and we further demonstrate our unchanged method applied directly to synthetic pie charts (0.8343 F1). Datasets, trained models, and evaluation code are available at https://github.com/BNLNLP/PPN_model.
AI Key Findings
Get AI-generated insights about this paper's methodology, results, significance, and more — seven facets brought into focus.
Impact
Paper Details
Authors
PDF Preview
Key Terms
Citation Network
Current paper (gray), citations (green), references (blue)
Display is limited for performance on very large graphs.
Discussion 0