Data Point Selection for Line Chart Visualization: Methodological Assessment and Evidence-Based Guidelines
Publication
Metrics
AI Quick Summary
This paper proposes a comprehensive evaluation methodology for data point selection algorithms used in downsampling time series data for line chart visualization. It introduces a novel concept of "visual stability" and assesses four algorithms across three visualization toolkits, providing evidence-based guidelines for effective visualization at scale. The methodology and results are openly shared to facilitate reproducibility and future research.
Paper Preview
Abstract
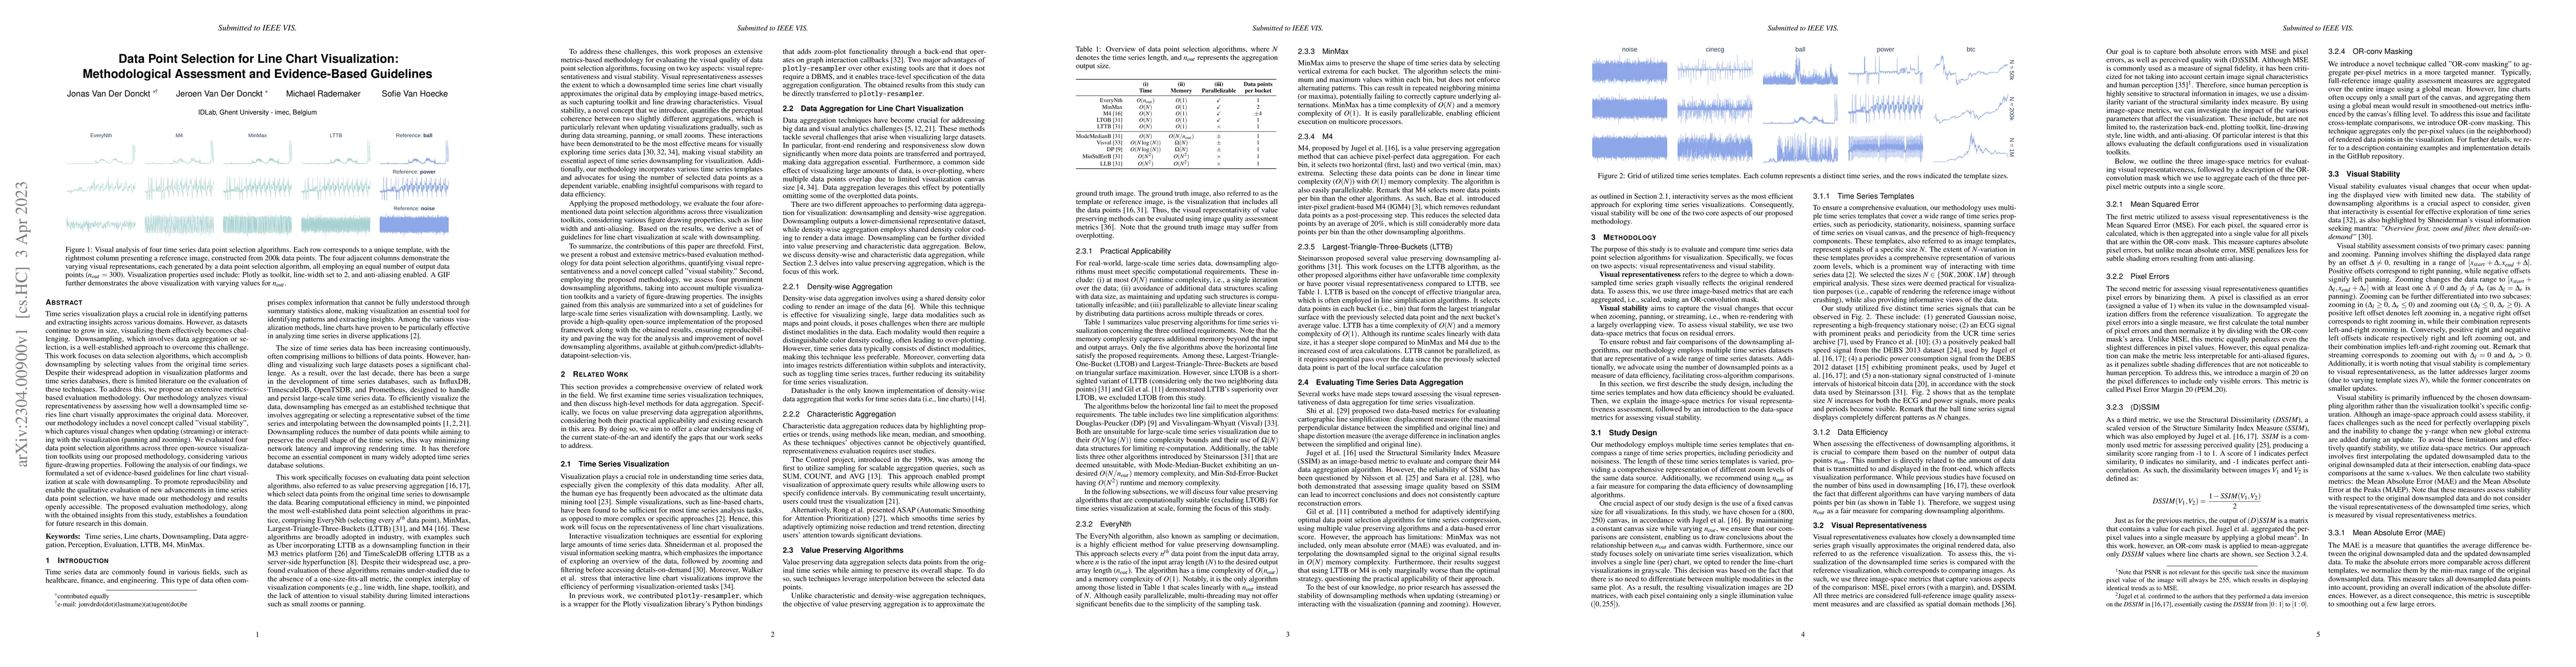
Time series visualization plays a crucial role in identifying patterns and extracting insights across various domains. However, as datasets continue to grow in size, visualizing them effectively becomes challenging. Downsampling, which involves data aggregation or selection, is a well-established approach to overcome this challenge. This work focuses on data selection algorithms, which accomplish downsampling by selecting values from the original time series. Despite their widespread adoption in visualization platforms and time series databases, there is limited literature on the evaluation of these techniques. To address this, we propose an extensive metrics-based evaluation methodology. Our methodology analyzes visual representativeness by assessing how well a downsampled time series line chart visually approximates the original data. Moreover, our methodology includes a novel concept called "visual stability", which captures visual changes when updating (streaming) or interacting with the visualization (panning and zooming). We evaluated four data point selection algorithms across three open-source visualization toolkits using our proposed methodology, considering various figure-drawing properties. Following the analysis of our findings, we formulated a set of evidence-based guidelines for line chart visualization at scale with downsampling. To promote reproducibility and enable the qualitative evaluation of new advancements in time series data point selection, we have made our methodology and results openly accessible. The proposed evaluation methodology, along with the obtained insights from this study, establishes a foundation for future research in this domain.
AI Key Findings
Get AI-generated insights about this paper's methodology, results, significance, and more — seven facets brought into focus.
Impact
Paper Details
Authors
PDF Preview
Key Terms
Citation Network
Current paper (gray), citations (green), references (blue)
Display is limited for performance on very large graphs.
Discussion 0