Assessing Text Mining and Technical Analyses on Forecasting Financial Time Series
Publication
Metrics
AI Quick Summary
This paper evaluates the effectiveness of text mining and technical analysis for forecasting the S&P500 during the pandemic, finding that the FinBERT model, using NLP techniques on financial news, outperforms traditional methods in predicting stock market movements. The study highlights the potential of text mining to enhance financial forecasting.
Paper Preview
Abstract
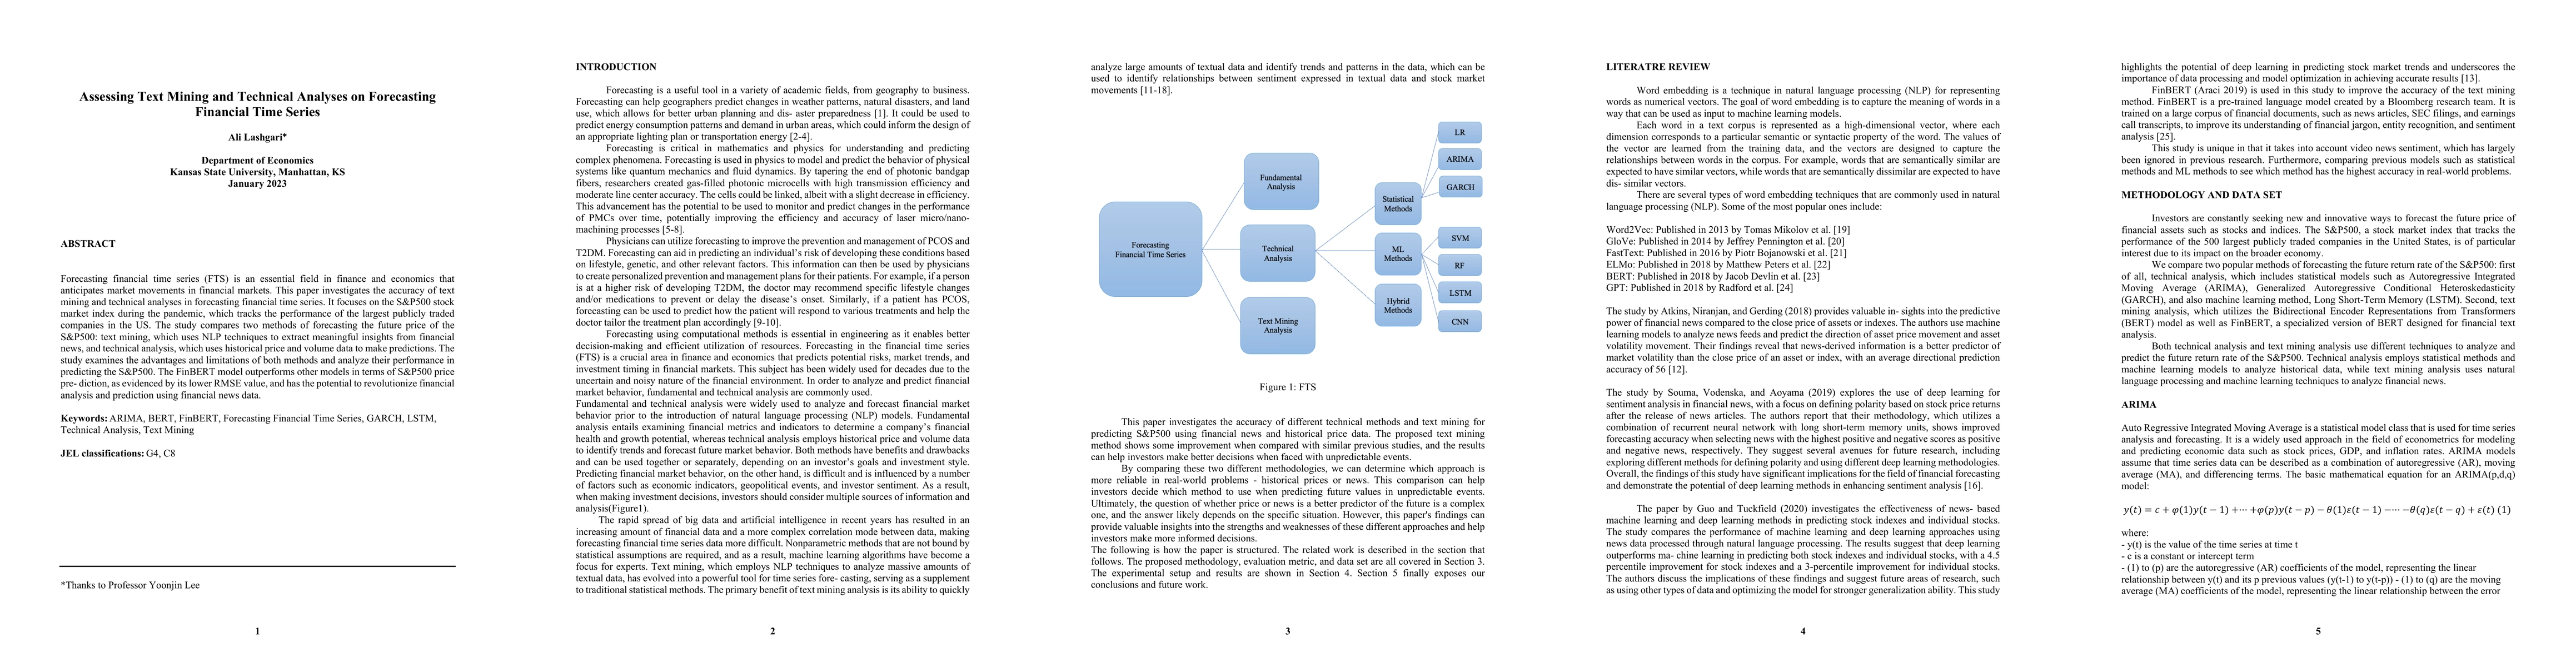
Forecasting financial time series (FTS) is an essential field in finance and economics that anticipates market movements in financial markets. This paper investigates the accuracy of text mining and technical analyses in forecasting financial time series. It focuses on the S&P500 stock market index during the pandemic, which tracks the performance of the largest publicly traded companies in the US. The study compares two methods of forecasting the future price of the S&P500: text mining, which uses NLP techniques to extract meaningful insights from financial news, and technical analysis, which uses historical price and volume data to make predictions. The study examines the advantages and limitations of both methods and analyze their performance in predicting the S&P500. The FinBERT model outperforms other models in terms of S&P500 price prediction, as evidenced by its lower RMSE value, and has the potential to revolutionize financial analysis and prediction using financial news data. Keywords: ARIMA, BERT, FinBERT, Forecasting Financial Time Series, GARCH, LSTM, Technical Analysis, Text Mining JEL classifications: G4, C8
AI Key Findings
Get AI-generated insights about this paper's methodology, results, significance, and more — seven facets brought into focus.
Impact
Paper Details
Authors
PDF Preview
Key Terms
Citation Network
Current paper (gray), citations (green), references (blue)
Display is limited for performance on very large graphs.
Discussion 0