Publication
Metrics
AI Quick Summary
This paper investigates the effectiveness of automatic y-axis rescaling in dynamic visualizations, finding that the optimal rescaling strategy is task- and data-dependent. Through Mechanical Turk experiments, it concludes that no single rescaling policy is universally effective, highlighting the need for context-specific approaches.
Paper Preview
Abstract
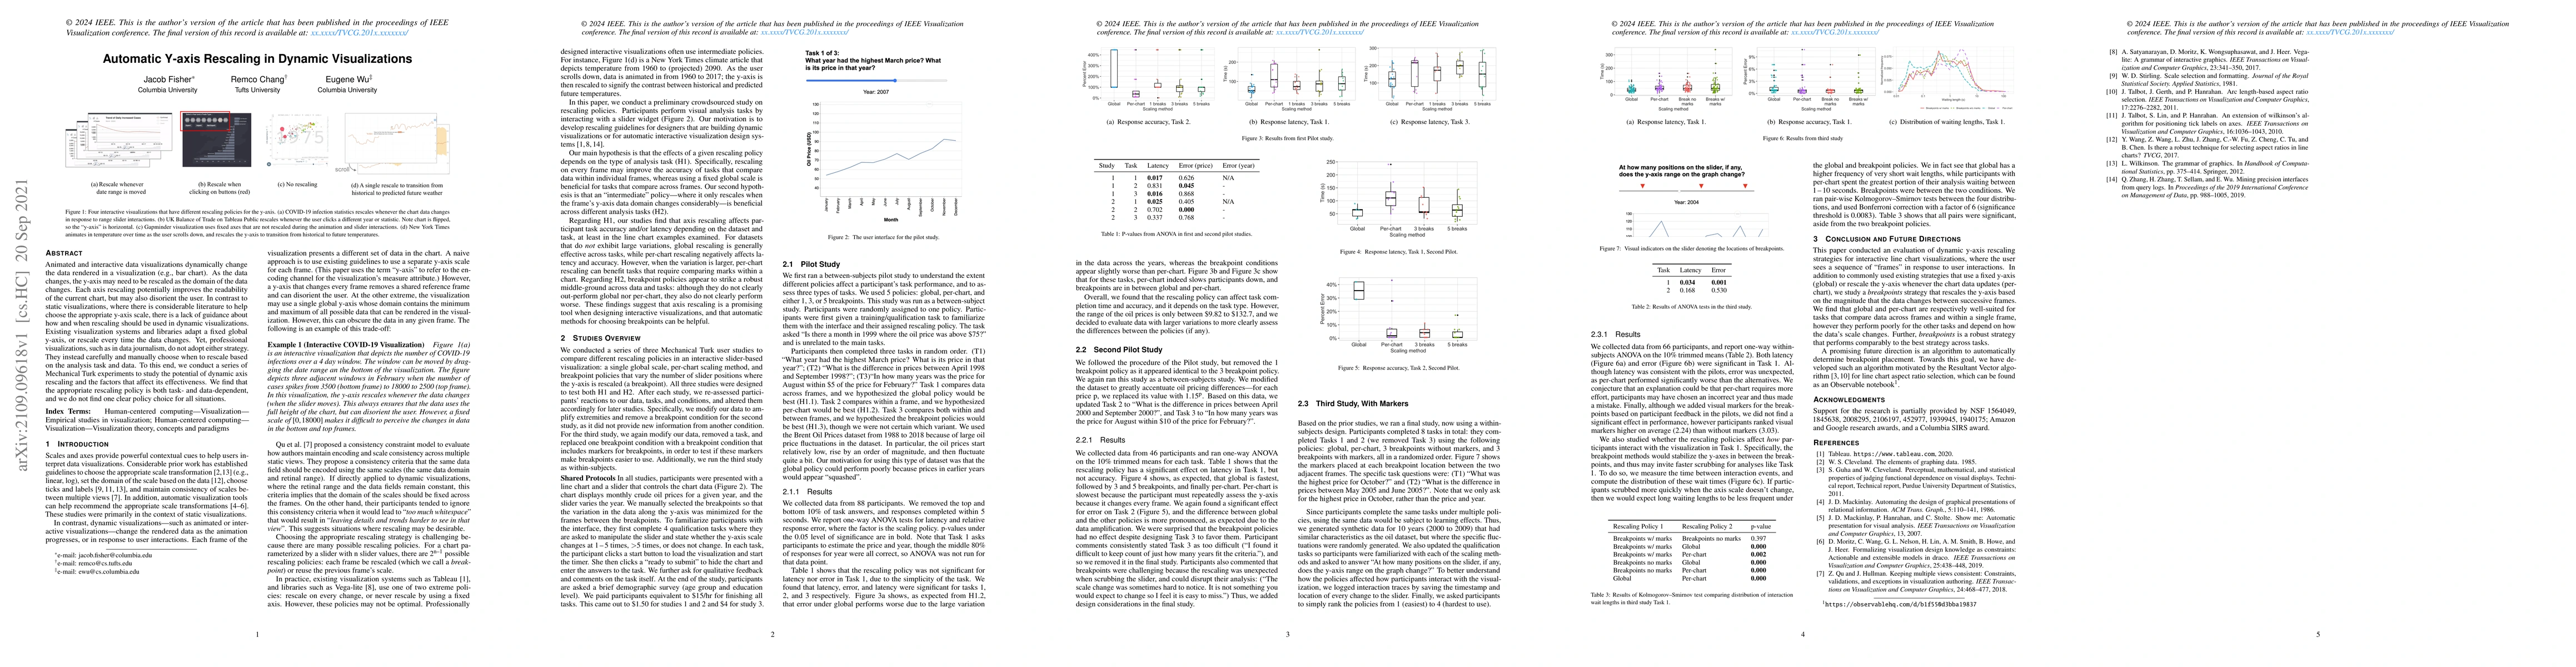
Animated and interactive data visualizations dynamically change the data rendered in a visualization (e.g., bar chart). As the data changes, the y-axis may need to be rescaled as the domain of the data changes. Each axis rescaling potentially improves the readability of the current chart, but may also disorient the user. In contrast to static visualizations, where there is considerable literature to help choose the appropriate y-axis scale, there is a lack of guidance about how and when rescaling should be used in dynamic visualizations. Existing visualization systems and libraries adapt a fixed global y-axis, or rescale every time the data changes. Yet, professional visualizations, such as in data journalism, do not adopt either strategy. They instead carefully and manually choose when to rescale based on the analysis task and data. To this end, we conduct a series of Mechanical Turk experiments to study the potential of dynamic axis rescaling and the factors that affect its effectiveness. We find that the appropriate rescaling policy is both task- and data-dependent, and we do not find one clear policy choice for all situations.
AI Key Findings
Get AI-generated insights about this paper's methodology, results, significance, and more — seven facets brought into focus.
Impact
Paper Details
Authors
PDF Preview
Key Terms
Citation Network
Current paper (gray), citations (green), references (blue)
Display is limited for performance on very large graphs.
Discussion 0