Casting Multiple Shadows: High-Dimensional Interactive Data Visualisation with Tours and Embeddings
Publication
Metrics
Paper Preview
Abstract
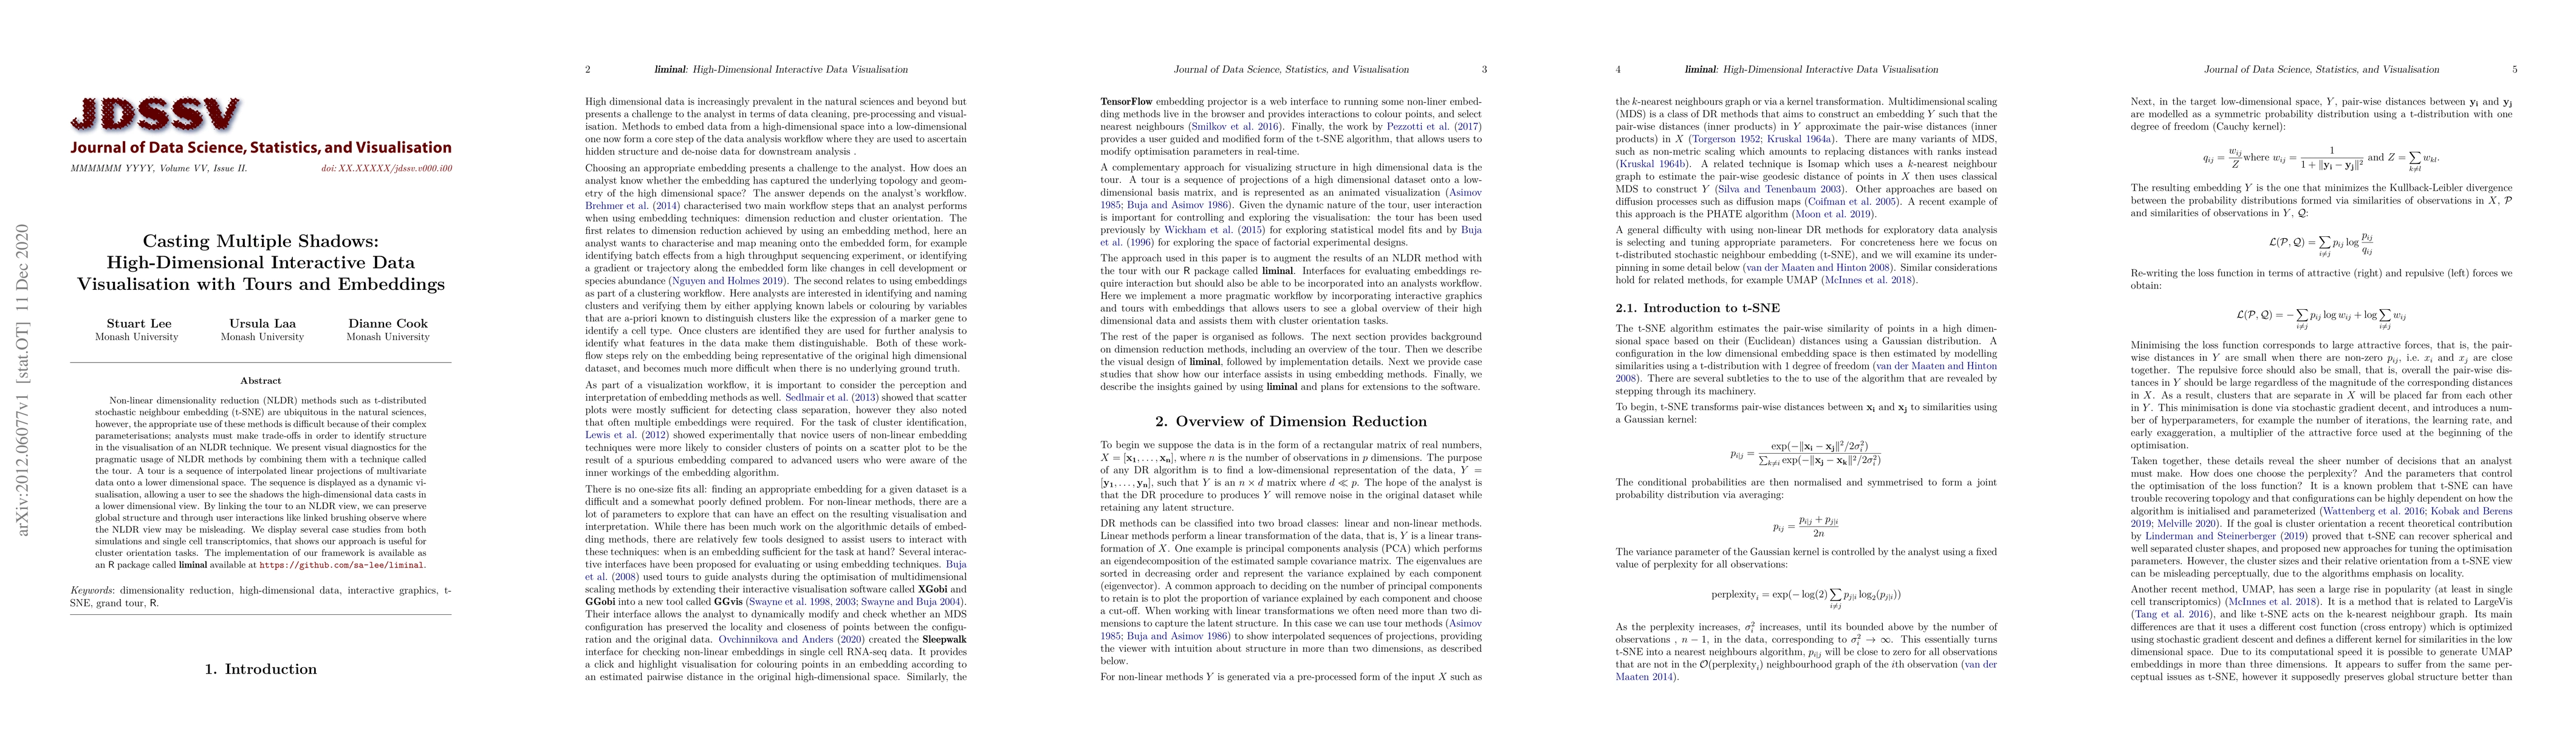
Non-linear dimensionality reduction (NLDR) methods such as t-distributed stochastic neighbour embedding (t-SNE) are ubiquitous in the natural sciences, however, the appropriate use of these methods is difficult because of their complex parameterisations; analysts must make trade-offs in order to identify structure in the visualisation of an NLDR technique. We present visual diagnostics for the pragmatic usage of NLDR methods by combining them with a technique called the tour. A tour is a sequence of interpolated linear projections of multivariate data onto a lower dimensional space. The sequence is displayed as a dynamic visualisation, allowing a user to see the shadows the high-dimensional data casts in a lower dimensional view. By linking the tour to an NLDR view, we can preserve global structure and through user interactions like linked brushing observe where the NLDR view may be misleading. We display several case studies from both simulations and single cell transcriptomics, that shows our approach is useful for cluster orientation tasks.
AI Key Findings
Get AI-generated insights about this paper's methodology, results, significance, and more — seven facets brought into focus.
Impact
Paper Details
Authors
PDF Preview
Key Terms
Citation Network
Current paper (gray), citations (green), references (blue)
Display is limited for performance on very large graphs.
Discussion 0