Summary
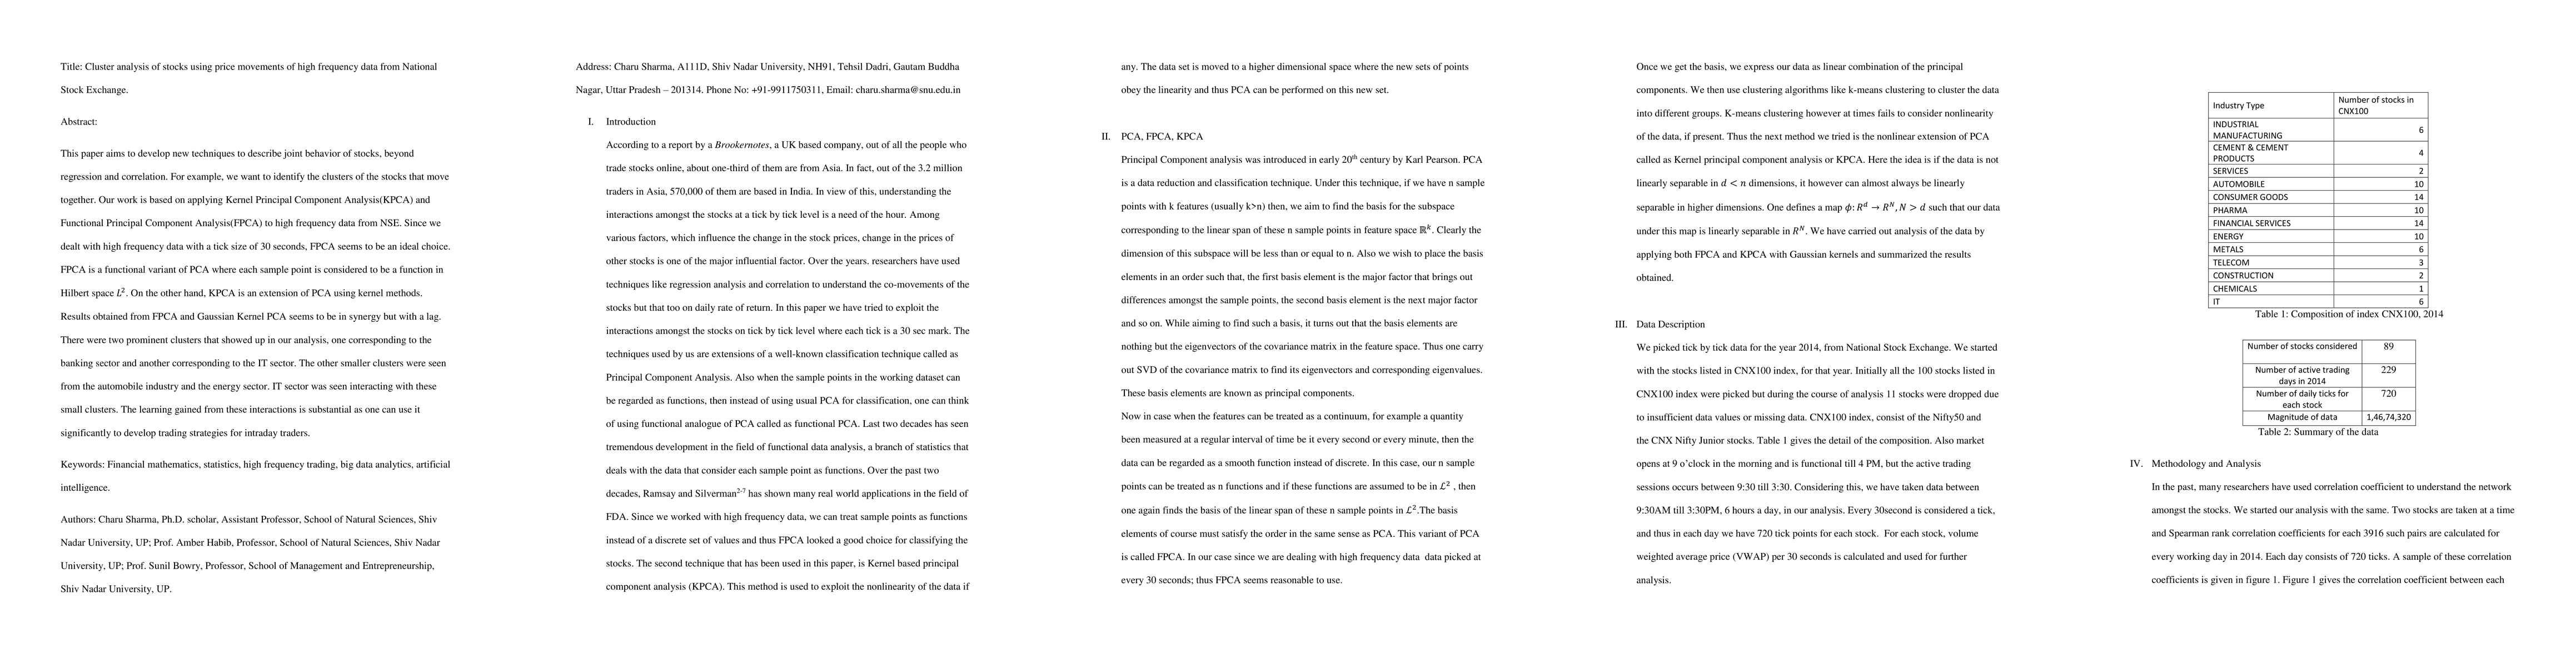
This paper aims to develop new techniques to describe joint behavior of stocks, beyond regression and correlation. For example, we want to identify the clusters of the stocks that move together. Our work is based on applying Kernel Principal Component Analysis(KPCA) and Functional Principal Component Analysis(FPCA) to high frequency data from NSE. Since we dealt with high frequency data with a tick size of 30 seconds, FPCA seems to be an ideal choice. FPCA is a functional variant of PCA where each sample point is considered to be a function in Hilbert space L^2. On the other hand, KPCA is an extension of PCA using kernel methods. Results obtained from FPCA and Gaussian Kernel PCA seems to be in synergy but with a lag. There were two prominent clusters that showed up in our analysis, one corresponding to the banking sector and another corresponding to the IT sector. The other smaller clusters were seen from the automobile industry and the energy sector. IT sector was seen interacting with these small clusters. The learning gained from these interactions is substantial as one can use it significantly to develop trading strategies for intraday traders.
AI Key Findings
Get AI-generated insights about this paper's methodology, results, and significance.
Paper Details
PDF Preview
Key Terms
Citation Network
Current paper (gray), citations (green), references (blue)
Display is limited for performance on very large graphs.
Similar Papers
Found 4 papersAn Exploratory Study of Stock Price Movements from Earnings Calls
Yang Yang, Sourav Medya, Brian Uzzi et al.
| Title | Authors | Year | Actions |
|---|
Comments (0)