Summary
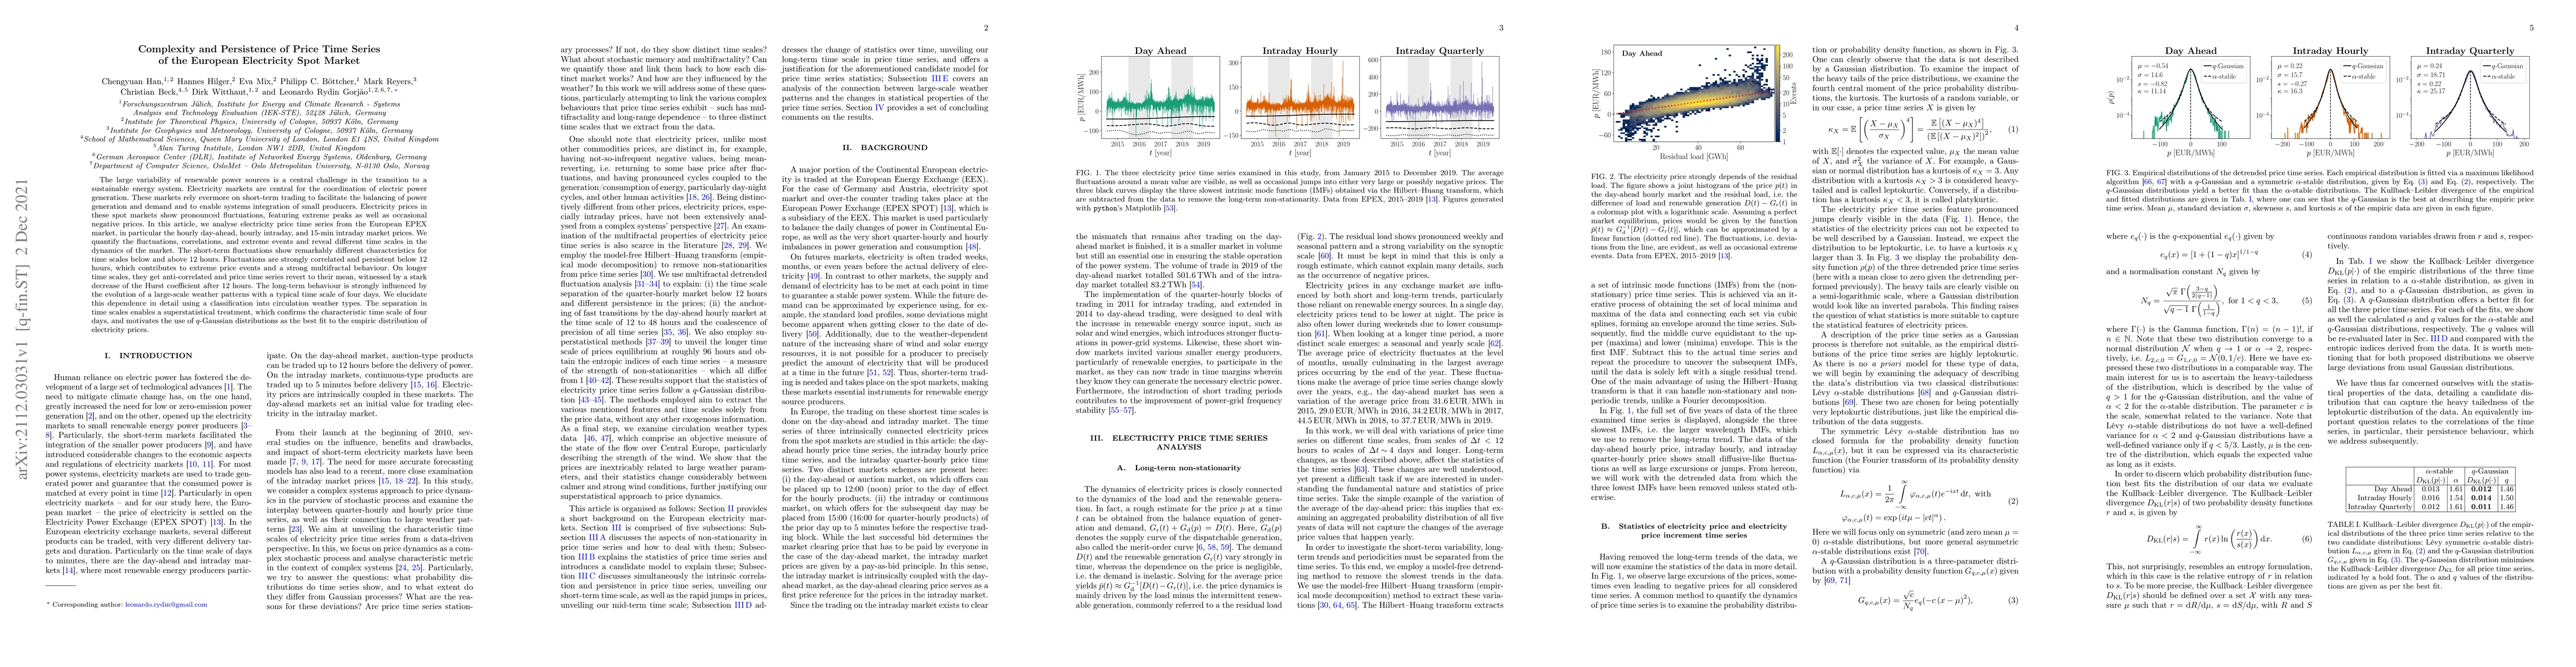
The large variability of renewable power sources is a central challenge in the transition to a sustainable energy system. Electricity markets are central for the coordination of electric power generation. These markets rely evermore on short-term trading to facilitate the balancing of power generation and demand and to enable systems integration of small producers. Electricity prices in these spot markets show pronounced fluctuations, featuring extreme peaks as well as occasional negative prices. In this article, we analyse electricity price time series from the European EPEX market, in particular the hourly day-ahead, hourly intraday, and 15-min intraday market prices. We quantify the fluctuations, correlations, and extreme events and reveal different time scales in the dynamics of the market. The short-term fluctuations show remarkably different characteristics for time scales below and above 12 hours. Fluctuations are strongly correlated and persistent below 12 hours, which contributes to extreme price events and a strong multifractal behaviour. On longer time scales, they get anti-correlated and price time series revert to their mean, witnessed by a stark decrease of the Hurst coefficient after 12 hours. The long-term behaviour is strongly influenced by the evolution of a large-scale weather patterns with a typical time scale of four days. We elucidate this dependence in detail using a classification into circulation weather types. The separation in time scales enables a superstatistical treatment, which confirms the characteristic time scale of four days, and motivates the use of $q$-Gaussian distributions as the best fit to the empiric distribution of electricity prices.
AI Key Findings
Get AI-generated insights about this paper's methodology, results, and significance.
Paper Details
PDF Preview
Key Terms
Citation Network
Current paper (gray), citations (green), references (blue)
Display is limited for performance on very large graphs.
Similar Papers
Found 4 papersRepresentative electricity price profiles for European day-ahead and intraday spot markets
Alexander Mitsos, Chrysanthi Papadimitriou, Jan C. Schulze
A Comparative Study of Factor Models for Different Periods of the Electricity Spot Price Market
Christian Laudagé, Florian Aichinger, Sascha Desmettre
| Title | Authors | Year | Actions |
|---|
Comments (0)