Connecting Sharpe ratio and Student t-statistic, and beyond
Publication
Metrics
AI Quick Summary
This paper derives the exact distribution of the Sharpe ratio for normally distributed returns, showing it follows a non-centered Student t-distribution. It also demonstrates the asymptotic optimality of the empirical Sharpe ratio and extends the analysis to AR(1) processes and heteroscedasticity, providing general formulas for these cases.
Paper Preview
Abstract
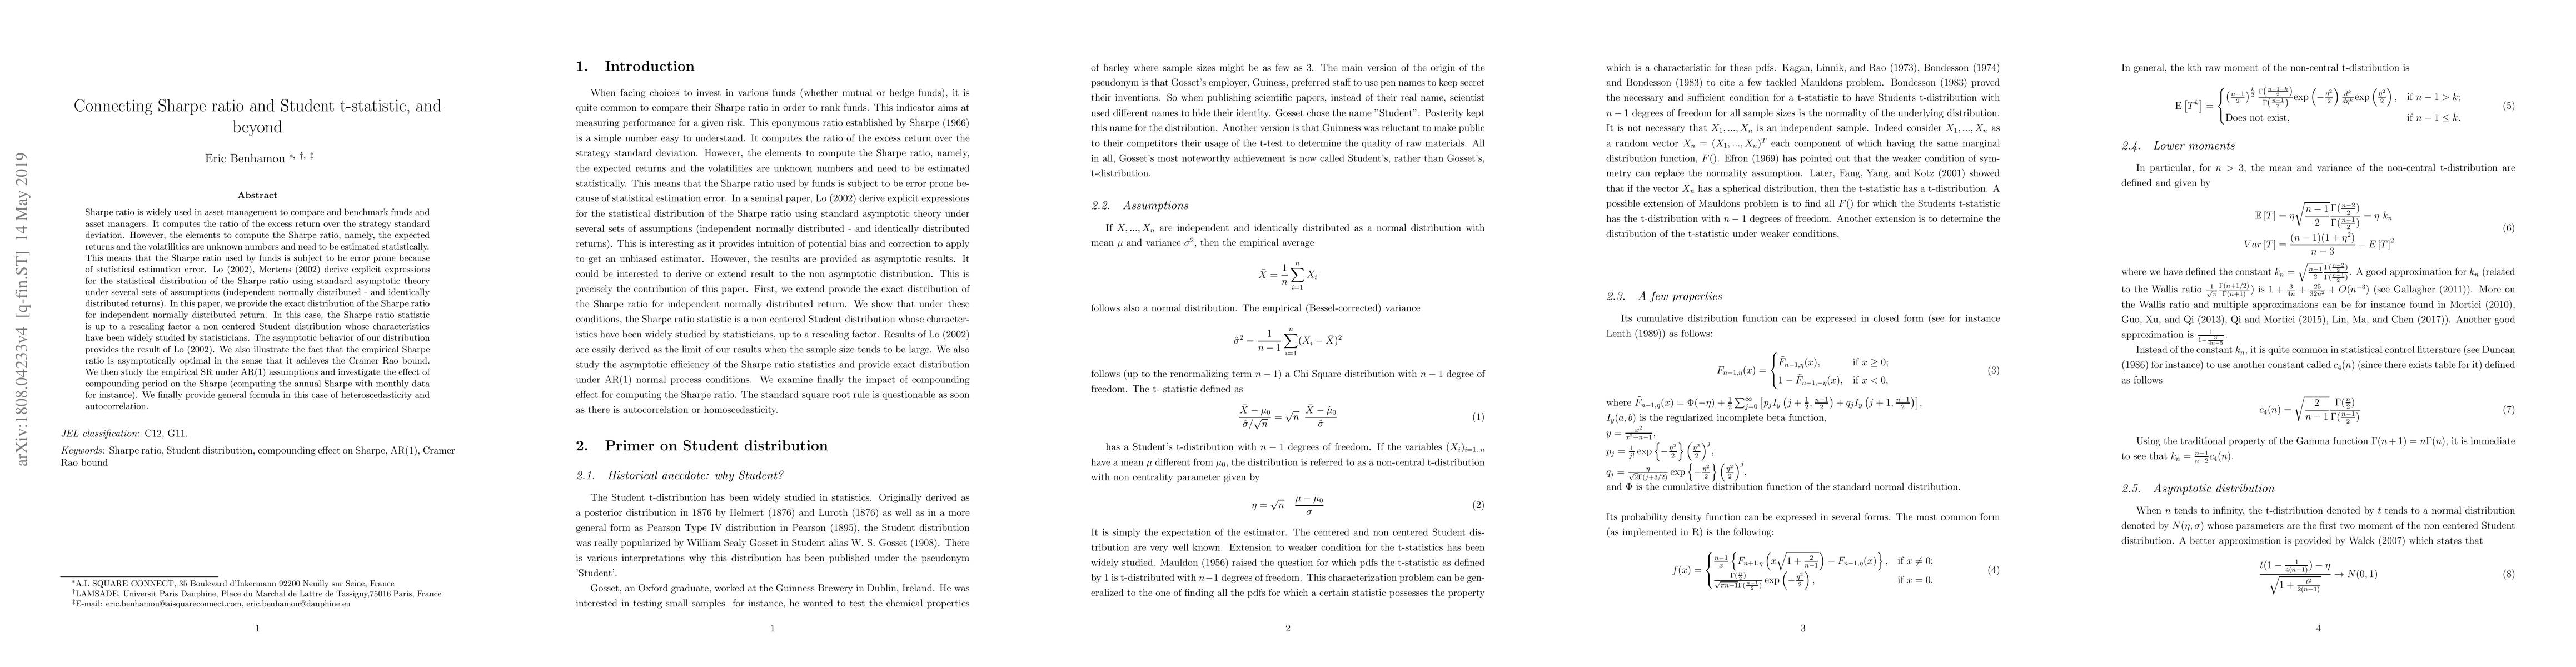
Sharpe ratio is widely used in asset management to compare and benchmark funds and asset managers. It computes the ratio of the excess return over the strategy standard deviation. However, the elements to compute the Sharpe ratio, namely, the expected returns and the volatilities are unknown numbers and need to be estimated statistically. This means that the Sharpe ratio used by funds is subject to be error prone because of statistical estimation error. Lo (2002), Mertens (2002) derive explicit expressions for the statistical distribution of the Sharpe ratio using standard asymptotic theory under several sets of assumptions (independent normally distributed - and identically distributed returns). In this paper, we provide the exact distribution of the Sharpe ratio for independent normally distributed return. In this case, the Sharpe ratio statistic is up to a rescaling factor a non centered Student distribution whose characteristics have been widely studied by statisticians. The asymptotic behavior of our distribution provide the result of Lo (2002). We also illustrate the fact that the empirical Sharpe ratio is asymptotically optimal in the sense that it achieves the Cramer Rao bound. We then study the empirical SR under AR(1) assumptions and investigate the effect of compounding period on the Sharpe (computing the annual Sharpe with monthly data for instance). We finally provide general formula in this case of heteroscedasticity and autocorrelation.
AI Key Findings
Get AI-generated insights about this paper's methodology, results, significance, and more — seven facets brought into focus.
Impact
Paper Details
PDF Preview
Key Terms
Citation Network
Current paper (gray), citations (green), references (blue)
Display is limited for performance on very large graphs.
Discussion 0