Publication
Metrics
AI Quick Summary
This paper investigates methods to improve the false alarm behavior of EWMA $S^2$ control charts when the in-control variance level must be estimated from a preliminary sample. It proposes adjusting the probability of false alarms instead of the unconditional in-control average run length, developing numerical algorithms for this purpose and providing an R package for implementation.
Paper Preview
Abstract
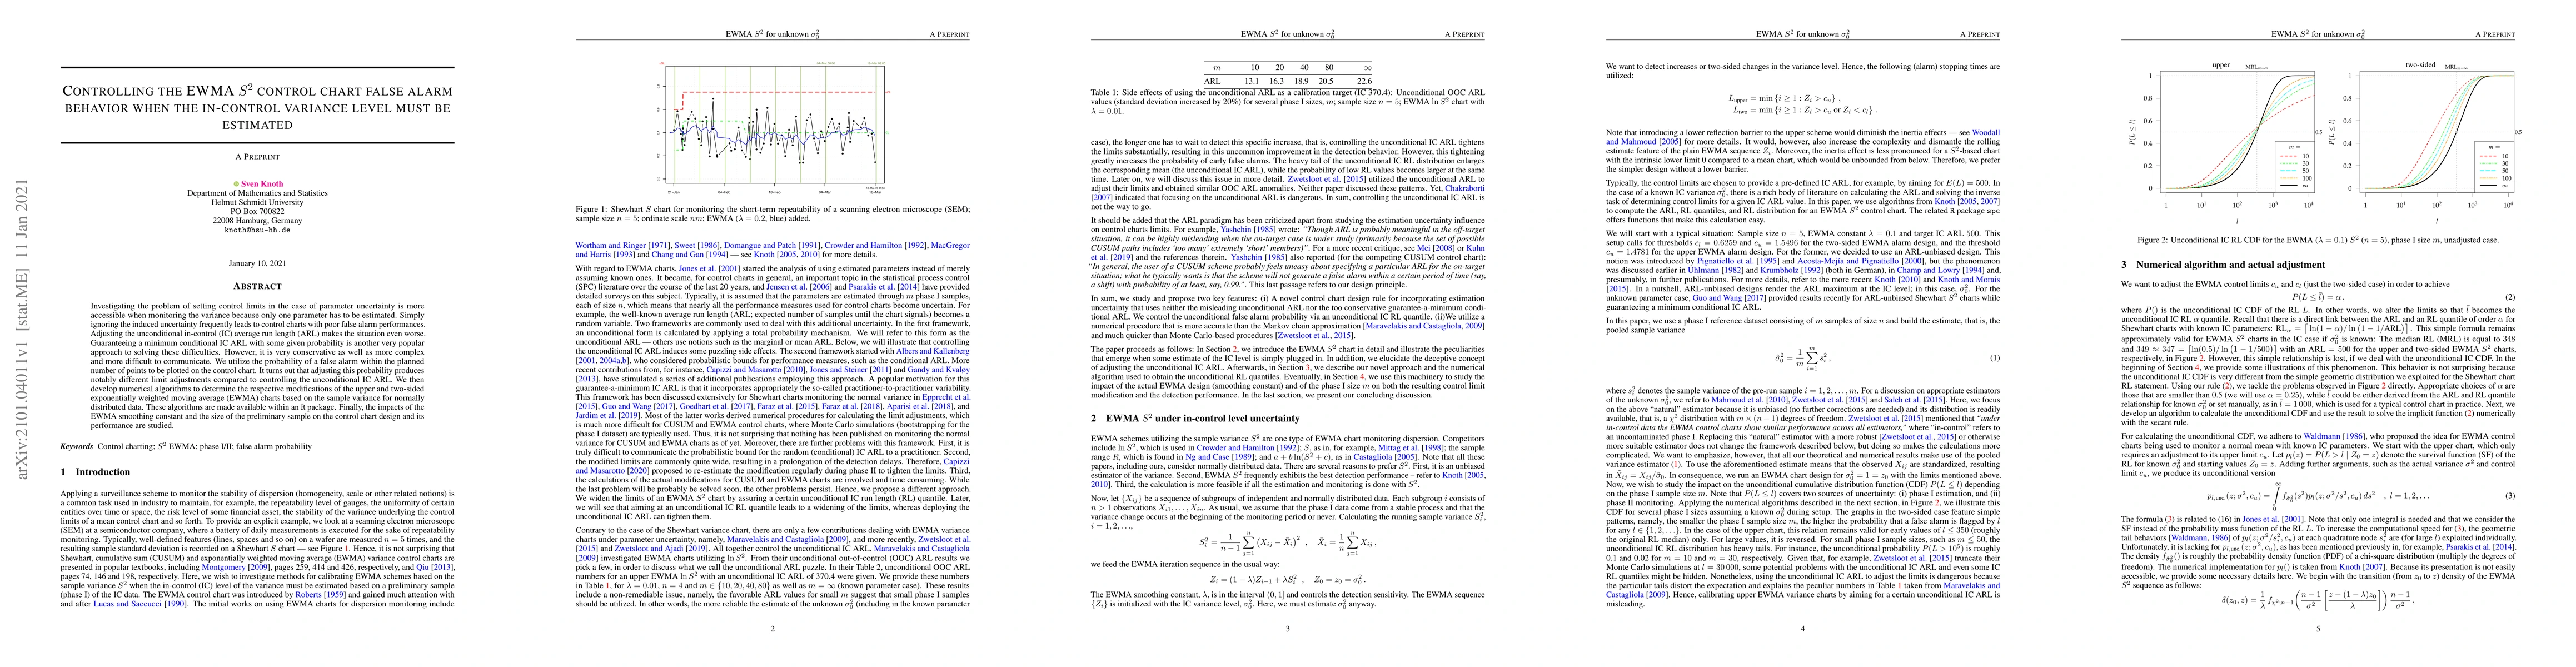
Investigating the problem of setting control limits in the case of parameter uncertainty is more accessible when monitoring the variance because only one parameter has to be estimated. Simply ignoring the induced uncertainty frequently leads to control charts with poor false alarm performances. Adjusting the unconditional in-control (IC) average run length (ARL) makes the situation even worse. Guaranteeing a minimum conditional IC ARL with some given probability is another very popular approach to solving these difficulties. However, it is very conservative as well as more complex and more difficult to communicate. We utilize the probability of a false alarm within the planned number of points to be plotted on the control chart. It turns out that adjusting this probability produces notably different limit adjustments compared to controlling the unconditional IC ARL. We then develop numerical algorithms to determine the respective modifications of the upper and two-sided exponentially weighted moving average (EWMA) charts based on the sample variance for normally distributed data. These algorithms are made available within an R package. Finally, the impacts of the EWMA smoothing constant and the size of the preliminary sample on the control chart design and its performance are studied.
AI Key Findings
Get AI-generated insights about this paper's methodology, results, significance, and more — seven facets brought into focus.
Impact
Paper Details
Authors
PDF Preview
Key Terms
Citation Network
Current paper (gray), citations (green), references (blue)
Display is limited for performance on very large graphs.
Discussion 0