Publication
Metrics
AI Quick Summary
This paper proposes the adaptive multivariate functional EWMA (AMFEWMA) control chart for monitoring quality characteristics represented as functional data. The AMFEWMA control chart outperforms existing methods, as demonstrated through extensive Monte Carlo simulations and a case study on monitoring resistance spot welding processes.
Paper Preview
Abstract
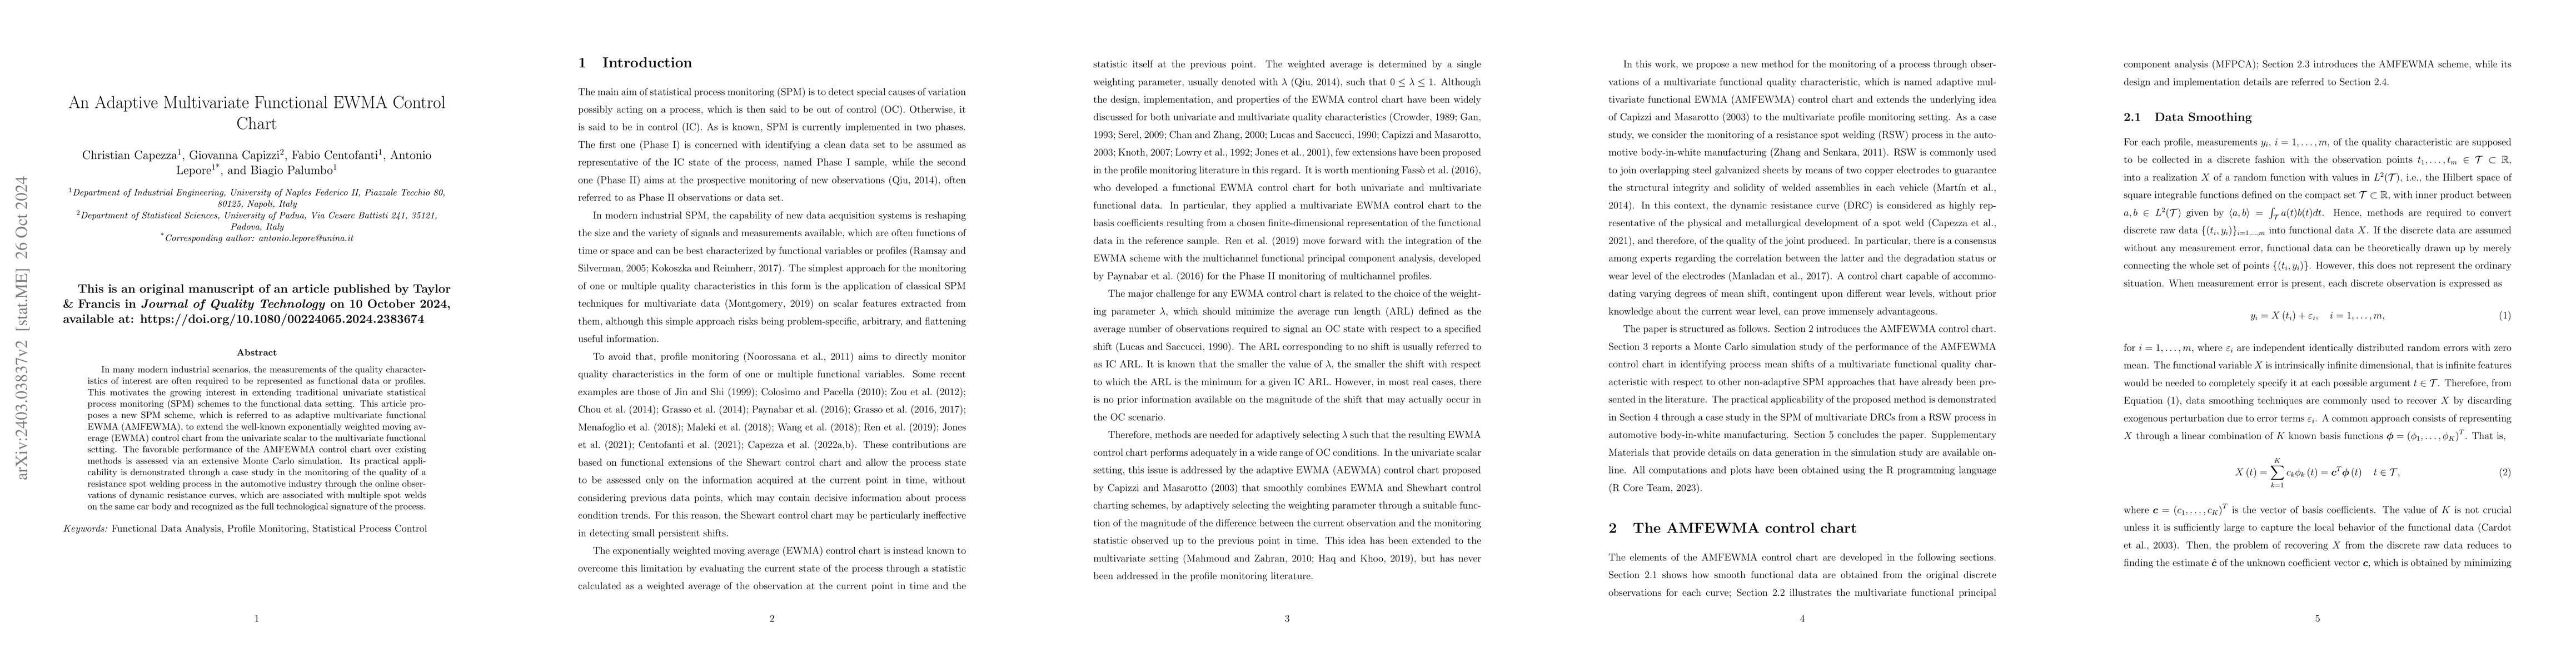
In many modern industrial scenarios, the measurements of the quality characteristics of interest are often required to be represented as functional data or profiles. This motivates the growing interest in extending traditional univariate statistical process monitoring (SPM) schemes to the functional data setting. This article proposes a new SPM scheme, which is referred to as adaptive multivariate functional EWMA (AMFEWMA), to extend the well-known exponentially weighted moving average (EWMA) control chart from the univariate scalar to the multivariate functional setting. The favorable performance of the AMFEWMA control chart over existing methods is assessed via an extensive Monte Carlo simulation. Its practical applicability is demonstrated through a case study in the monitoring of the quality of a resistance spot welding process in the automotive industry through the online observations of dynamic resistance curves, which are associated with multiple spot welds on the same car body and recognized as the full technological signature of the process.
AI Key Findings
Get AI-generated insights about this paper's methodology, results, significance, and more — seven facets brought into focus.
Impact
Paper Details
Authors
PDF Preview
Key Terms
Citation Network
Current paper (gray), citations (green), references (blue)
Display is limited for performance on very large graphs.
Discussion 0