Publication
Metrics
AI Quick Summary
This paper introduces a robust multivariate functional control chart (RoMFCC) to monitor high-dimensional manufacturing data, mitigating the impact of outliers through a framework combining outlier detection, data imputation, dimensionality reduction, and monitoring strategies. An extensive simulation and a real-case study in automotive resistance spot welding validate its effectiveness.
Paper Preview
Abstract
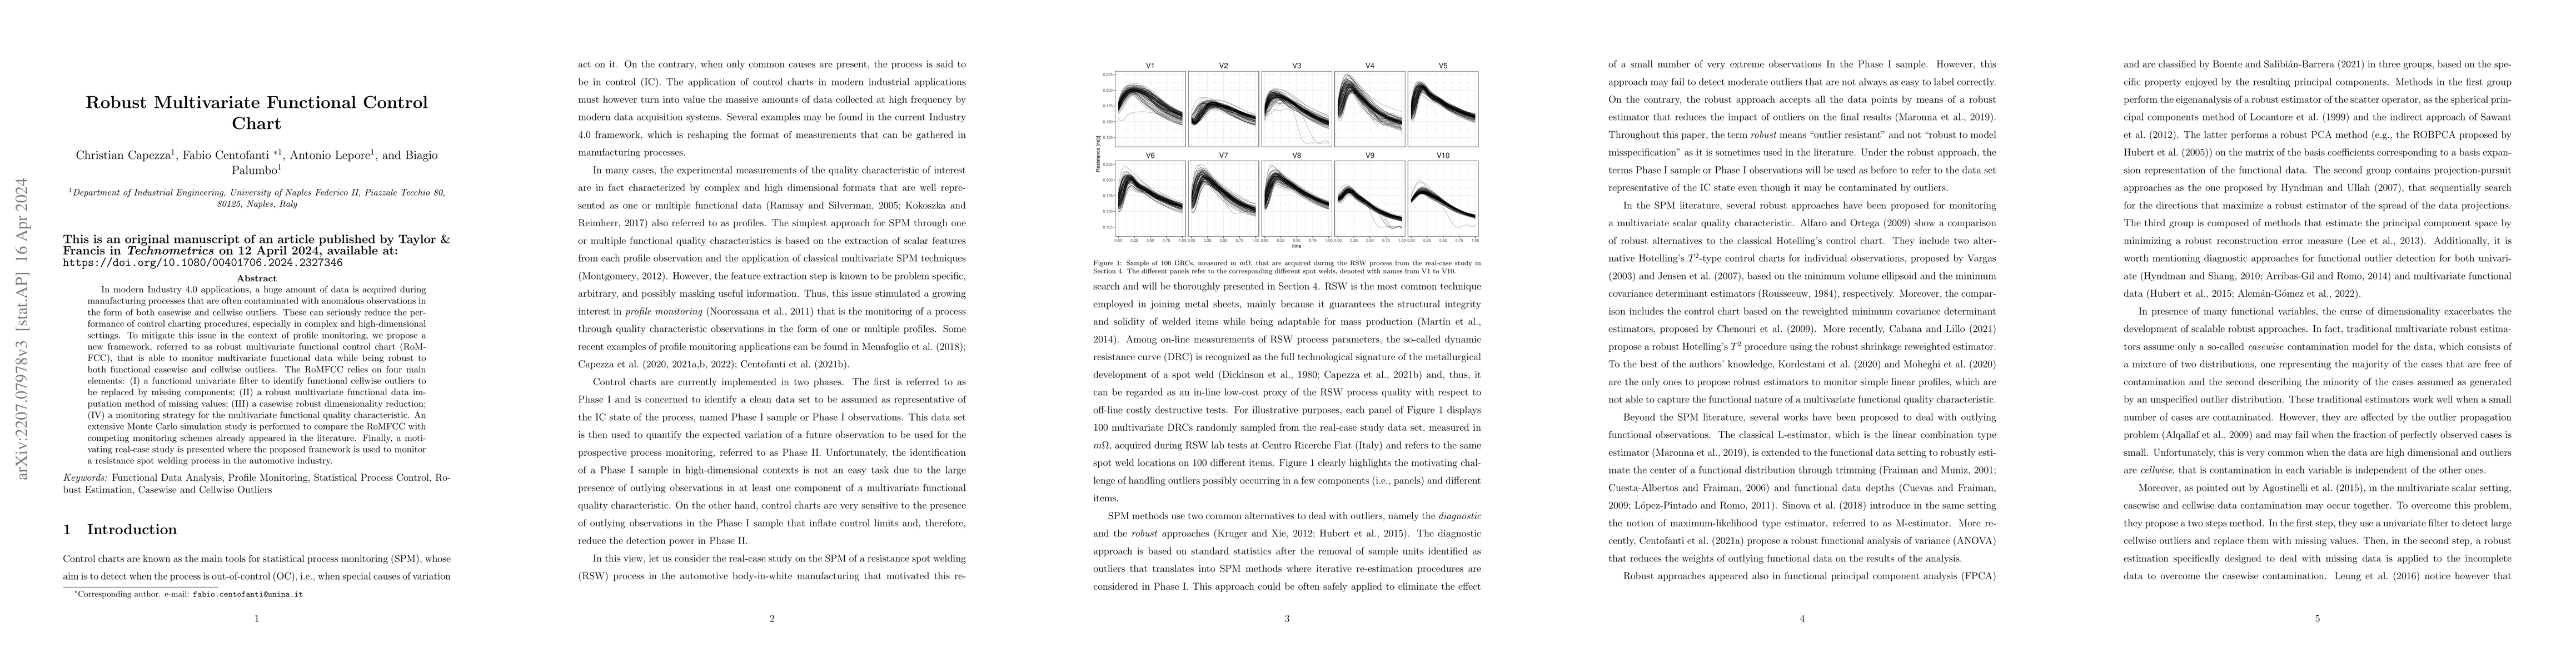
In modern Industry 4.0 applications, a huge amount of data is acquired during manufacturing processes that are often contaminated with anomalous observations in the form of both casewise and cellwise outliers. These can seriously reduce the performance of control charting procedures, especially in complex and high-dimensional settings. To mitigate this issue in the context of profile monitoring, we propose a new framework, referred to as robust multivariate functional control chart (RoMFCC), that is able to monitor multivariate functional data while being robust to both functional casewise and cellwise outliers. The RoMFCC relies on four main elements: (I) a functional univariate filter to identify functional cellwise outliers to be replaced by missing components; (II) a robust multivariate functional data imputation method of missing values; (III) a casewise robust dimensionality reduction; (IV) a monitoring strategy for the multivariate functional quality characteristic. An extensive Monte Carlo simulation study is performed to compare the RoMFCC with competing monitoring schemes already appeared in the literature. Finally, a motivating real-case study is presented where the proposed framework is used to monitor a resistance spot welding process in the automotive industry.
AI Key Findings
Get AI-generated insights about this paper's methodology, results, significance, and more — seven facets brought into focus.
Impact
Paper Details
Authors
PDF Preview
Key Terms
Citation Network
Current paper (gray), citations (green), references (blue)
Display is limited for performance on very large graphs.
Discussion 0