Publication
Metrics
AI Quick Summary
The paper introduces the functional mixture regression control chart (FMRCC) to monitor functional quality characteristics influenced by multiple in-control patterns and covariates. It uses a mixture of functional linear models and a likelihood ratio test for monitoring deviations, validated by a Monte Carlo simulation and a case study on resistance spot welding.
Paper Preview
Abstract
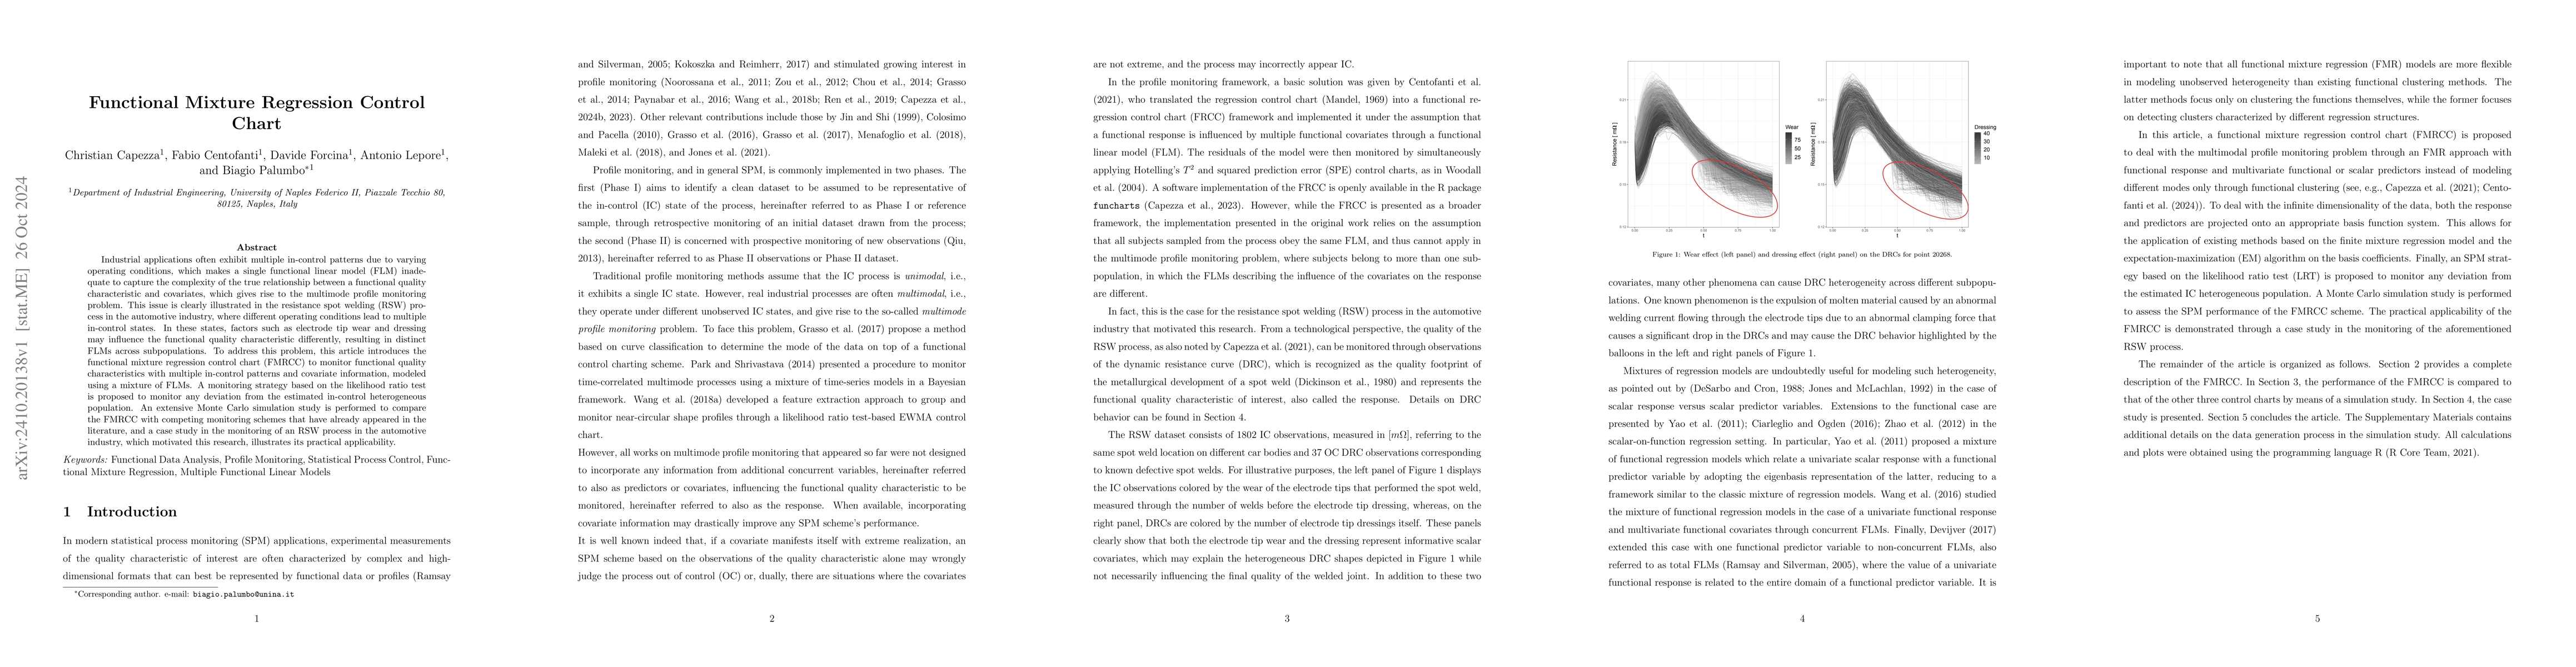
Industrial applications often exhibit multiple in-control patterns due to varying operating conditions, which makes a single functional linear model (FLM) inadequate to capture the complexity of the true relationship between a functional quality characteristic and covariates, which gives rise to the multimode profile monitoring problem. This issue is clearly illustrated in the resistance spot welding (RSW) process in the automotive industry, where different operating conditions lead to multiple in-control states. In these states, factors such as electrode tip wear and dressing may influence the functional quality characteristic differently, resulting in distinct FLMs across subpopulations. To address this problem, this article introduces the functional mixture regression control chart (FMRCC) to monitor functional quality characteristics with multiple in-control patterns and covariate information, modeled using a mixture of FLMs. A monitoring strategy based on the likelihood ratio test is proposed to monitor any deviation from the estimated in-control heterogeneous population. An extensive Monte Carlo simulation study is performed to compare the FMRCC with competing monitoring schemes that have already appeared in the literature, and a case study in the monitoring of an RSW process in the automotive industry, which motivated this research, illustrates its practical applicability.
AI Key Findings
Get AI-generated insights about this paper's methodology, results, significance, and more — seven facets brought into focus.
Impact
Authors
PDF Preview
Citation Network
Current paper (gray), citations (green), references (blue)
Display is limited for performance on very large graphs.
Discussion 0