Publication
Metrics
AI Quick Summary
This paper investigates the dynamics of cross-correlation in financial time series, revealing that the smallest eigenvalues of the cross-correlation matrix exhibit behavior opposite to the largest eigenvalue, regardless of time window size. A one-factor model is proposed to capture these dynamics, which is extended to a 'market plus sectors' model to incorporate sectoral features.
Paper Preview
Abstract
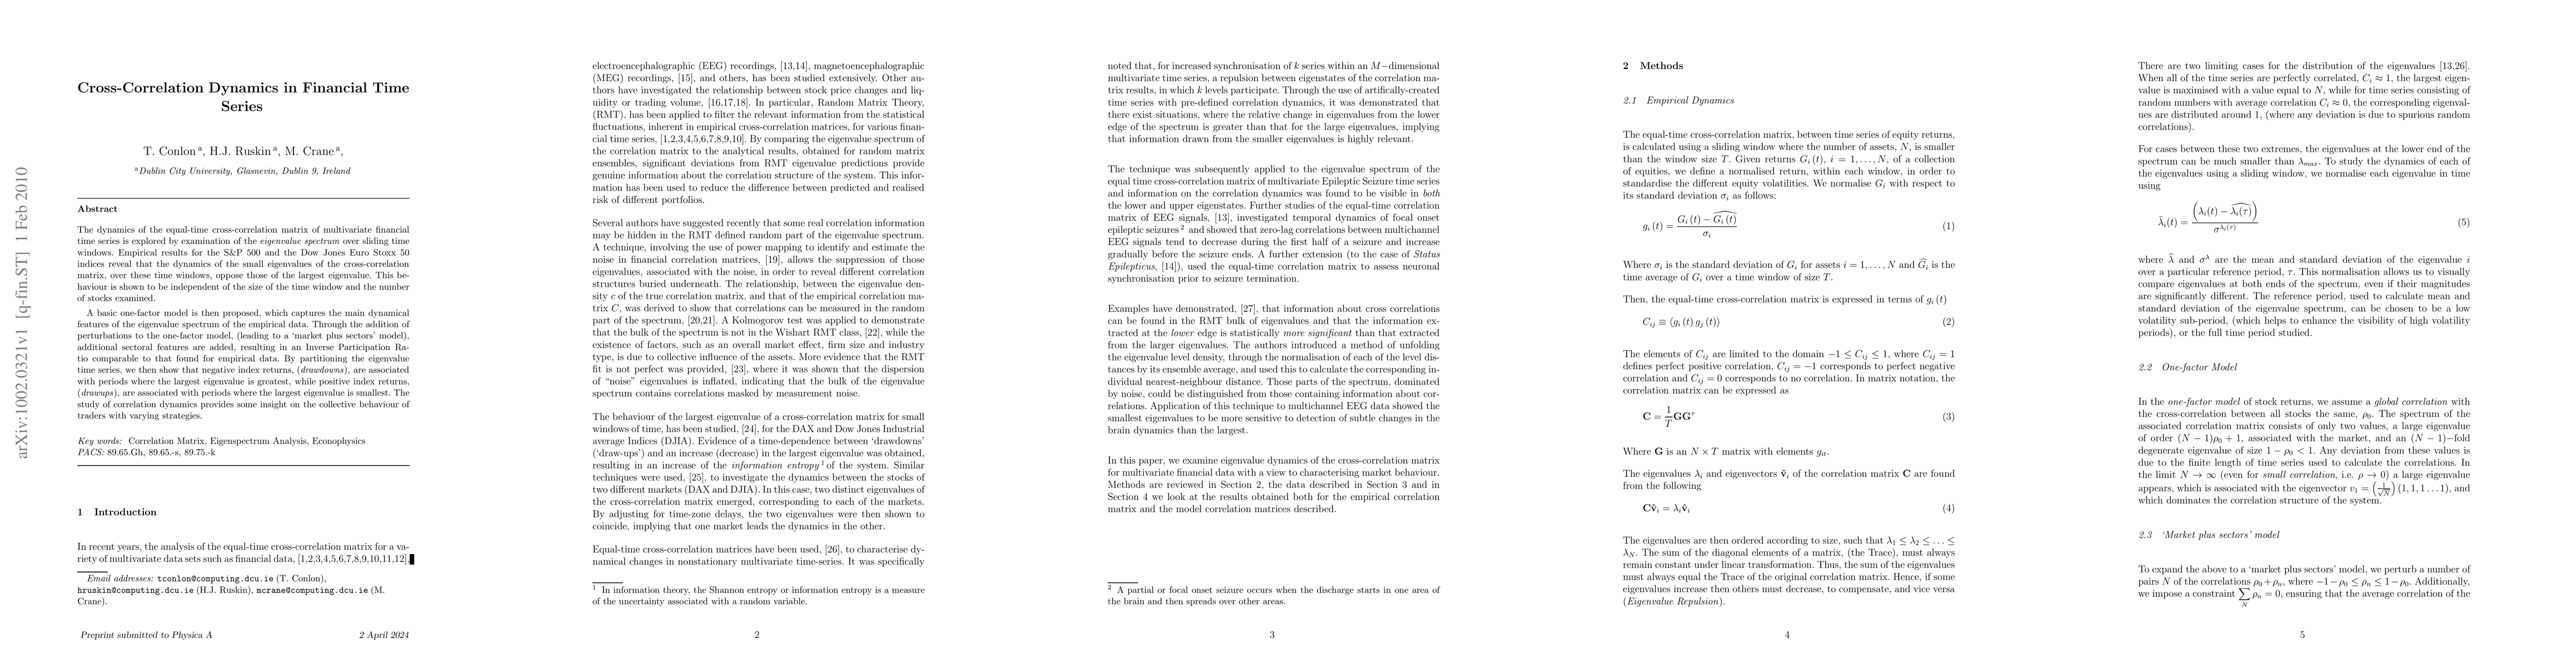
The dynamics of the equal-time cross-correlation matrix of multivariate financial time series is explored by examination of the eigenvalue spectrum over sliding time windows. Empirical results for the S&P 500 and the Dow Jones Euro Stoxx 50 indices reveal that the dynamics of the small eigenvalues of the cross-correlation matrix, over these time windows, oppose those of the largest eigenvalue. This behaviour is shown to be independent of the size of the time window and the number of stocks examined. A basic one-factor model is then proposed, which captures the main dynamical features of the eigenvalue spectrum of the empirical data. Through the addition of perturbations to the one-factor model, (leading to a 'market plus sectors' model), additional sectoral features are added, resulting in an Inverse Participation Ratio comparable to that found for empirical data. By partitioning the eigenvalue time series, we then show that negative index returns, (drawdowns), are associated with periods where the largest eigenvalue is greatest, while positive index returns, (drawups), are associated with periods where the largest eigenvalue is smallest. The study of correlation dynamics provides some insight on the collective behaviour of traders with varying strategies.
AI Key Findings
Get AI-generated insights about this paper's methodology, results, significance, and more — seven facets brought into focus.
Impact
Paper Details
PDF Preview
Key Terms
Citation Network
Current paper (gray), citations (green), references (blue)
Display is limited for performance on very large graphs.
Discussion 0