Publication
Metrics
AI Quick Summary
This paper analyzes relationships between stock prices, Twitter sentiment, and e-commerce behaviors using Hadoop, Hive, and Tableau, revealing trends and correlations that can inform business and investment decisions. The study aims to provide insights into the factors influencing market trends and user behavior.
Paper Preview
Abstract
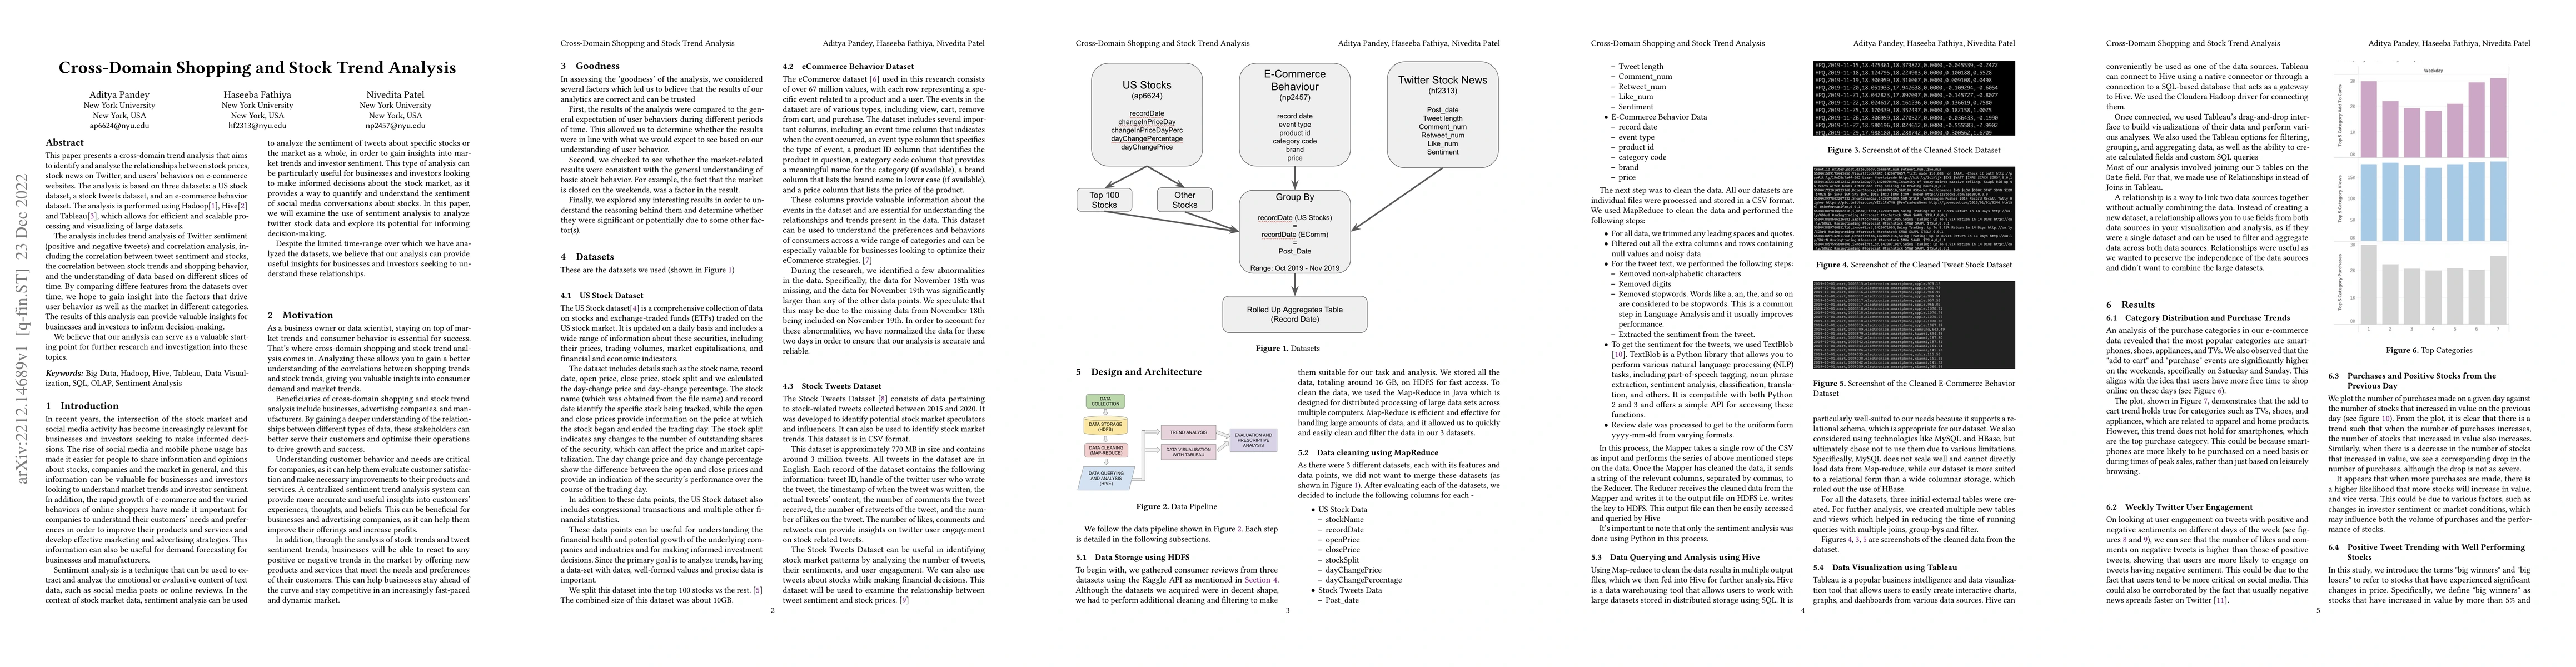
This paper presents a cross-domain trend analysis that aims to identify and analyze the relationships between stock prices, stock news on Twitter, and users' behaviors on e-commerce websites. The analysis is based on three datasets: a US stock dataset, a stock tweets dataset, and an e-commerce behavior dataset. The analysis is performed using Hadoop, Hive, and Tableau, allowing for efficient and scalable processing and visualizing large datasets. The analysis includes trend analysis of Twitter sentiment (positive and negative tweets) and correlation analysis, including the correlation between tweet sentiment and stocks, the correlation between stock trends and shopping behavior, and the understanding of data based on different slices of time. By comparing different features from the datasets over time, we hope to gain insight into the factors that drive user behavior as well as the market in different categories. The results of this analysis can provide valuable insights for businesses and investors to inform decision-making. We believe that our analysis can serve as a valuable starting point for further research and investigation into these topics.
AI Key Findings
Get AI-generated insights about this paper's methodology, results, significance, and more — seven facets brought into focus.
Impact
Paper Details
Authors
PDF Preview
Key Terms
Citation Network
Current paper (gray), citations (green), references (blue)
Display is limited for performance on very large graphs.
Discussion 0