Data Visualization on Day One: Bringing Big Ideas into Intro Stats Early and Often
Publication
Metrics
AI Quick Summary
This paper introduces an early data visualization activity in an introductory statistics course using R and R Markdown. Students engage in small group projects to explore a dataset, create three visualizations, and describe insights, fostering early exposure to statistical computing.
Paper Preview
Abstract
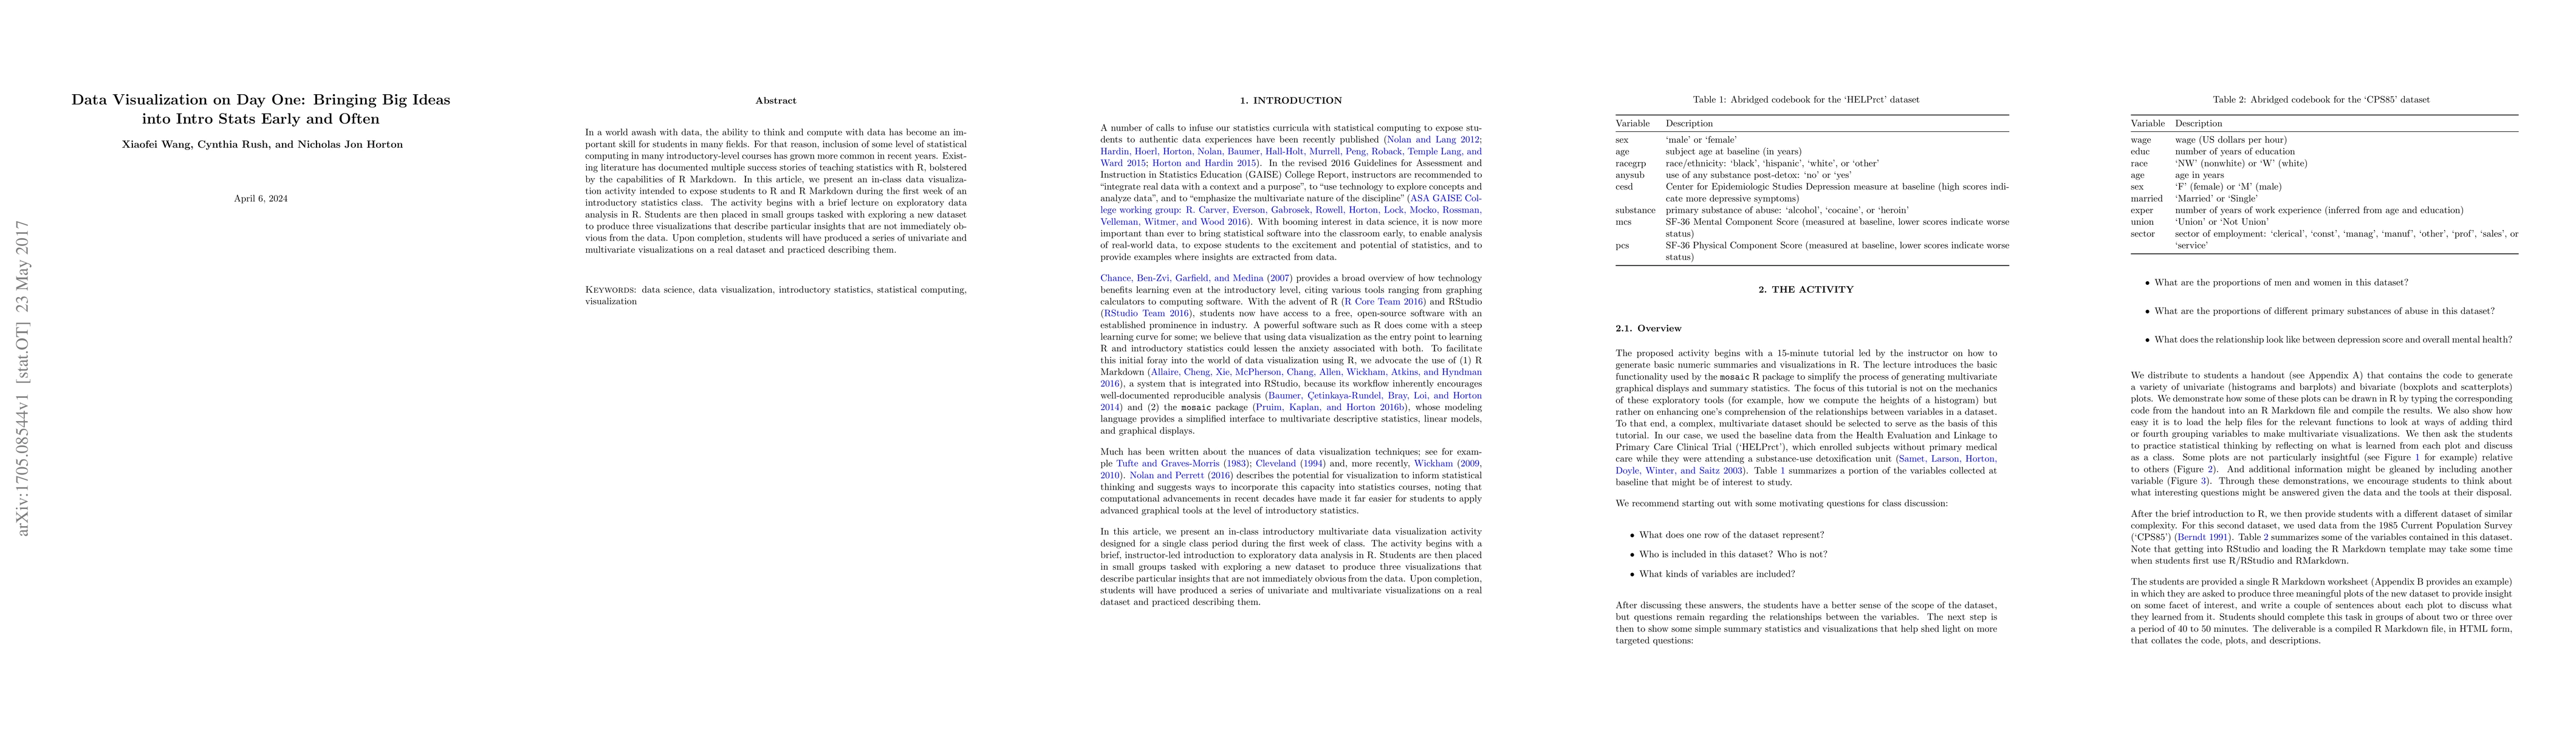
In a world awash with data, the ability to think and compute with data has become an important skill for students in many fields. For that reason, inclusion of some level of statistical computing in many introductory-level courses has grown more common in recent years. Existing literature has documented multiple success stories of teaching statistics with R, bolstered by the capabilities of R Markdown. In this article, we present an in-class data visualization activity intended to expose students to R and R Markdown during the first week of an introductory statistics class. The activity begins with a brief lecture on exploratory data analysis in R. Students are then placed in small groups tasked with exploring a new dataset to produce three visualizations that describe particular insights that are not immediately obvious from the data. Upon completion, students will have produced a series of univariate and multivariate visualizations on a real dataset and practiced describing them.
AI Key Findings
Get AI-generated insights about this paper's methodology, results, significance, and more — seven facets brought into focus.
Impact
Paper Details
Authors
PDF Preview
Key Terms
Citation Network
Current paper (gray), citations (green), references (blue)
Display is limited for performance on very large graphs.
Related Papers
No references found for this paper.
Discussion 0