Detection of a structural break in intraday volatility pattern
Publication
Metrics
AI Quick Summary
This paper develops a theory and testing procedures for detecting a structural break in intraday volatility patterns using Functional Data Analysis. It introduces three tests for changes in volatility curve shape, magnitude, and general sequence changes, validated by simulations and applied to US stocks.
Paper Preview
Abstract
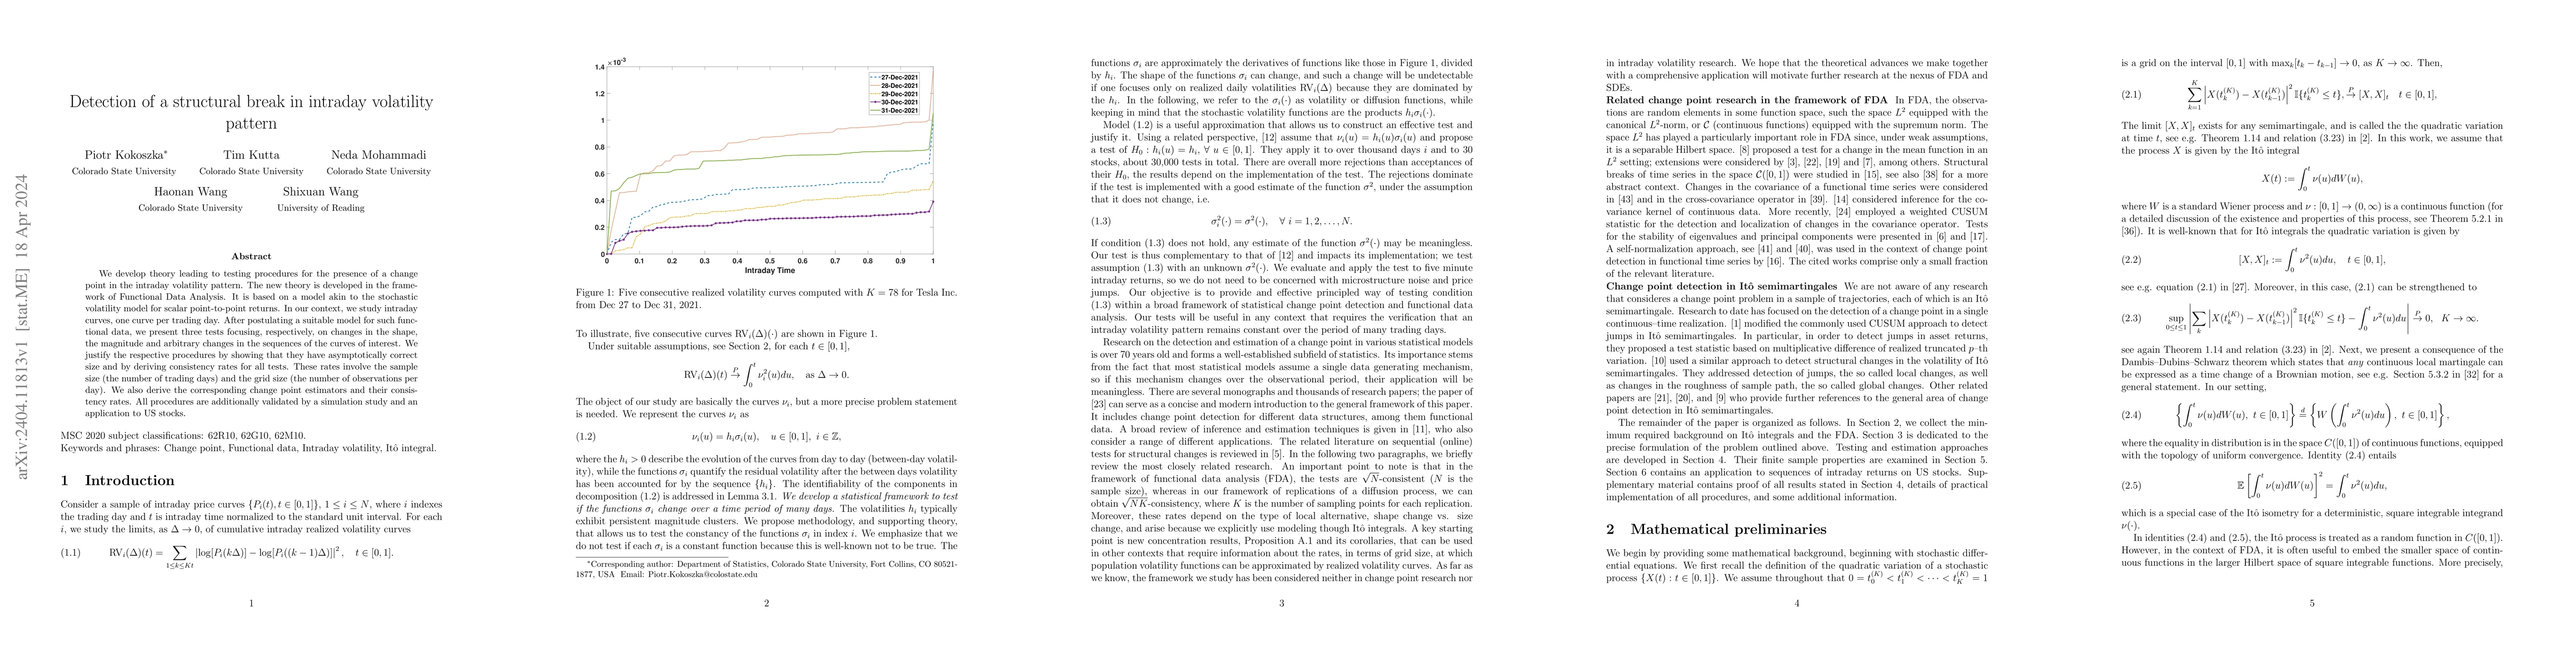
We develop theory leading to testing procedures for the presence of a change point in the intraday volatility pattern. The new theory is developed in the framework of Functional Data Analysis. It is based on a model akin to the stochastic volatility model for scalar point-to-point returns. In our context, we study intraday curves, one curve per trading day. After postulating a suitable model for such functional data, we present three tests focusing, respectively, on changes in the shape, the magnitude and arbitrary changes in the sequences of the curves of interest. We justify the respective procedures by showing that they have asymptotically correct size and by deriving consistency rates for all tests. These rates involve the sample size (the number of trading days) and the grid size (the number of observations per day). We also derive the corresponding change point estimators and their consistency rates. All procedures are additionally validated by a simulation study and an application to US stocks.
AI Key Findings
Get AI-generated insights about this paper's methodology, results, significance, and more — seven facets brought into focus.
Impact
Paper Details
Authors
PDF Preview
Key Terms
Citation Network
Current paper (gray), citations (green), references (blue)
Display is limited for performance on very large graphs.
Discussion 0