Summary
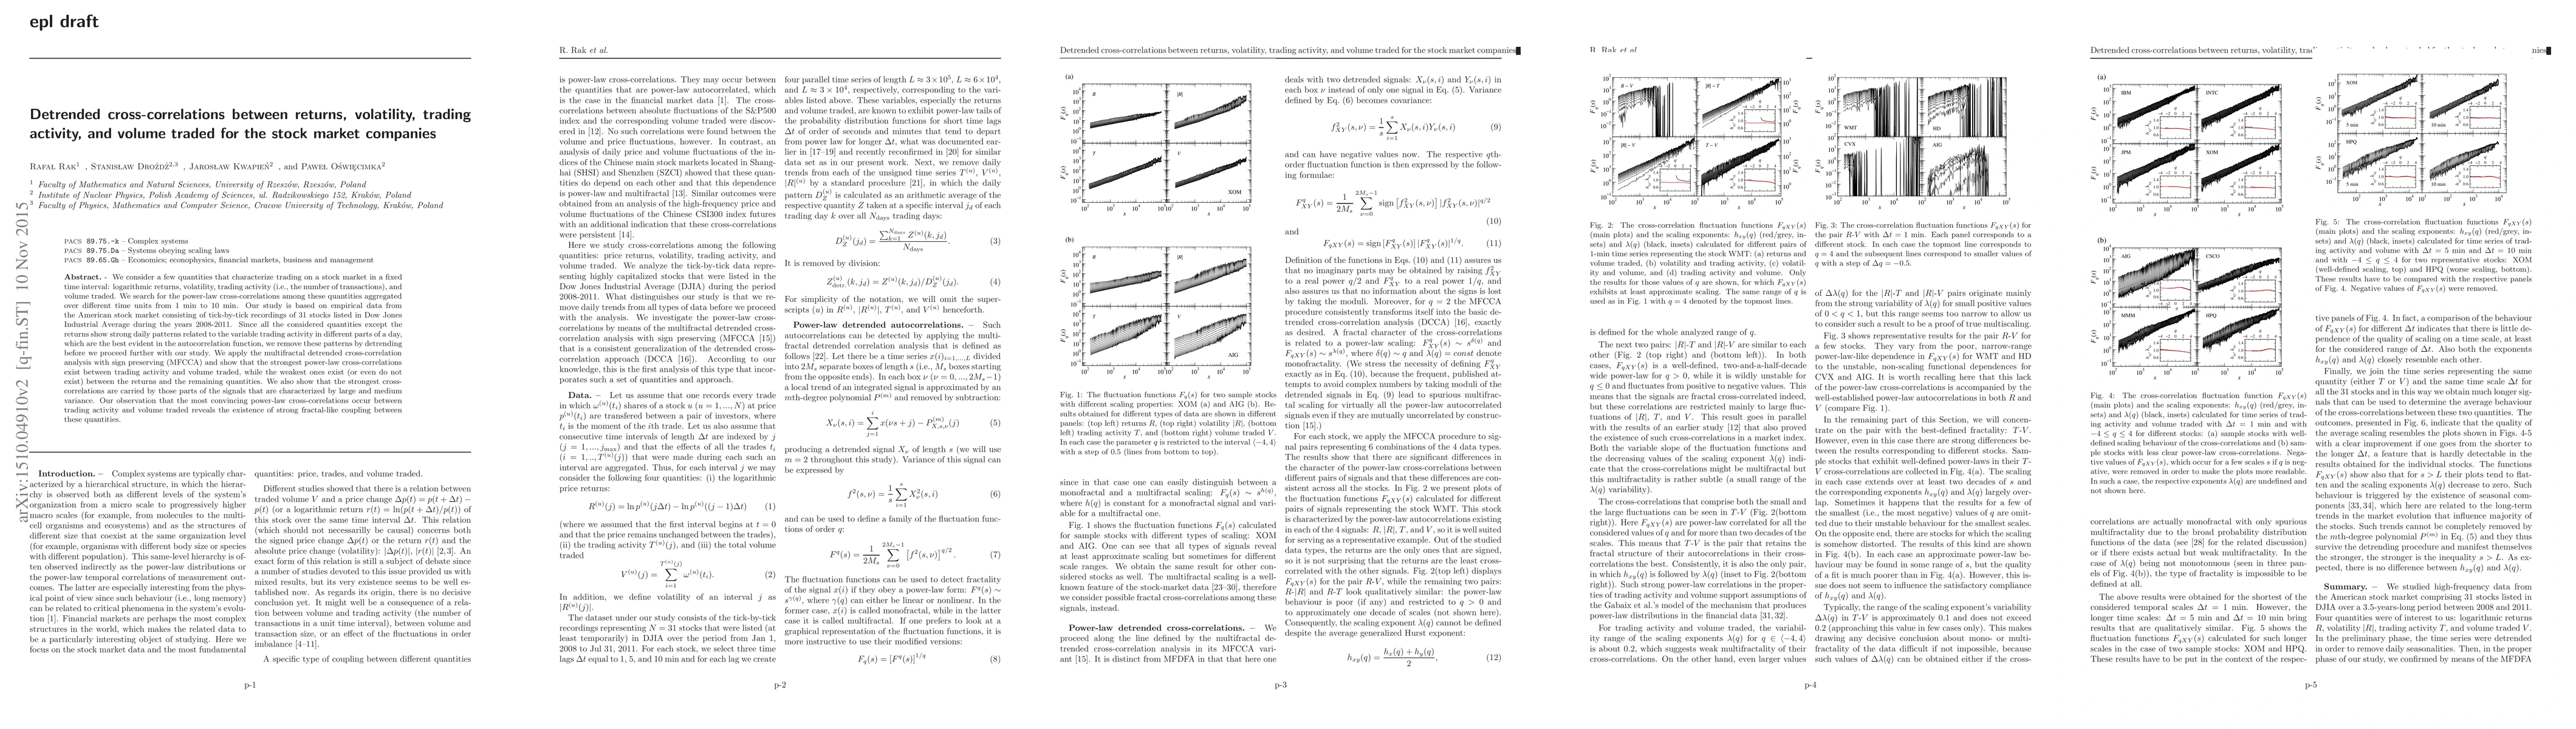
We consider a few quantities that characterize trading on a stock market in a fixed time interval: logarithmic returns, volatility, trading activity (i.e., the number of transactions), and volume traded. We search for the power-law cross-correlations among these quantities aggregated over different time units from 1 min to 10 min. Our study is based on empirical data from the American stock market consisting of tick-by-tick recordings of 31 stocks listed in Dow Jones Industrial Average during the years 2008-2011. Since all the considered quantities except the returns show strong daily patterns related to the variable trading activity in different parts of a day, which are the best evident in the autocorrelation function, we remove these patterns by detrending before we proceed further with our study. We apply the multifractal detrended cross-correlation analysis with sign preserving (MFCCA) and show that the strongest power-law cross-correlations exist between trading activity and volume traded, while the weakest ones exist (or even do not exist) between the returns and the remaining quantities. We also show that the strongest cross-correlations are carried by those parts of the signals that are characterized by large and medium variance. Our observation that the most convincing power-law cross-correlations occur between trading activity and volume traded reveals the existence of strong fractal-like coupling between these quantities.
AI Key Findings
Get AI-generated insights about this paper's methodology, results, and significance.
Paper Details
PDF Preview
Key Terms
Citation Network
Current paper (gray), citations (green), references (blue)
Display is limited for performance on very large graphs.
Similar Papers
Found 4 papers| Title | Authors | Year | Actions |
|---|
Comments (0)