Distinguishing manipulated stocks via trading network analysis
Publication
Metrics
AI Quick Summary
This research analyzes over a hundred stocks' transaction records over a year, constructing trading networks to identify manipulated stocks. Key findings include power-law distributions for node degree and strength, higher lower bounds in manipulated stocks' networks, increased average degrees, and lower correlation between price returns and seller-buyer ratios, aiding in manipulation detection.
Paper Preview
Abstract
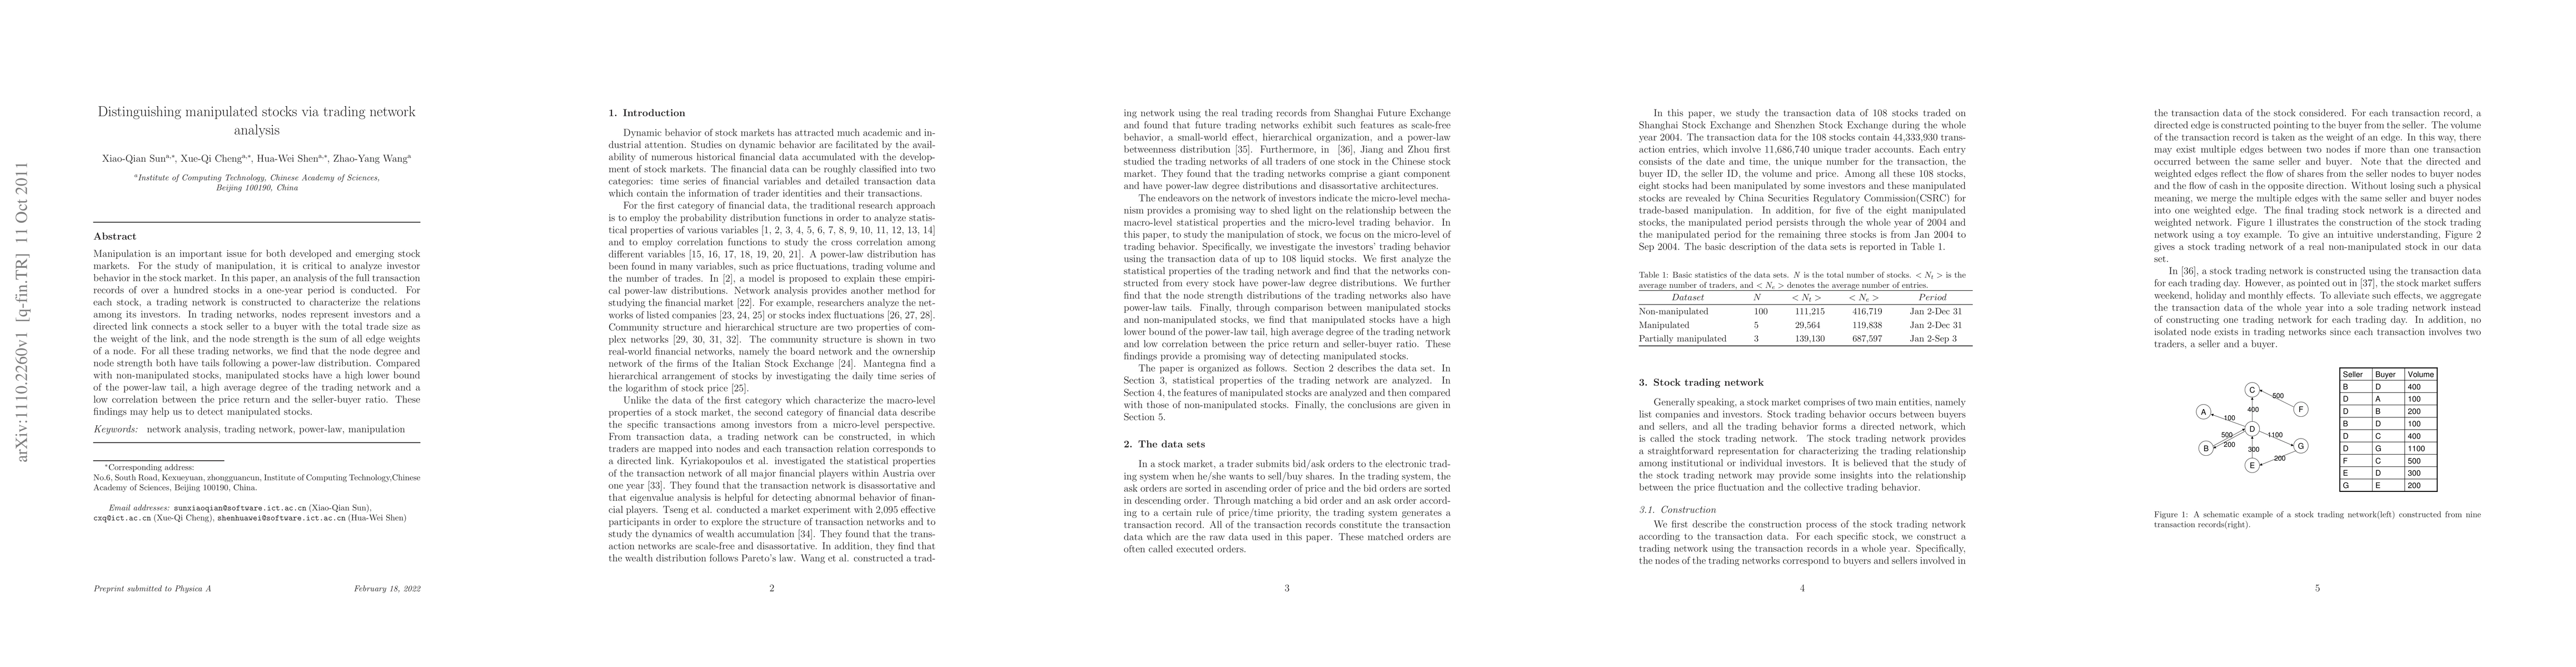
Manipulation is an important issue for both developed and emerging stock markets. For the study of manipulation, it is critical to analyze investor behavior in the stock market. In this paper, an analysis of the full transaction records of over a hundred stocks in a one-year period is conducted. For each stock, a trading network is constructed to characterize the relations among its investors. In trading networks, nodes represent investors and a directed link connects a stock seller to a buyer with the total trade size as the weight of the link, and the node strength is the sum of all edge weights of a node. For all these trading networks, we find that the node degree and node strength both have tails following a power-law distribution. Compared with non-manipulated stocks, manipulated stocks have a high lower bound of the power-law tail, a high average degree of the trading network and a low correlation between the price return and the seller-buyer ratio. These findings may help us to detect manipulated stocks.
AI Key Findings
Get AI-generated insights about this paper's methodology, results, significance, and more — seven facets brought into focus.
Impact
Paper Details
PDF Preview
Key Terms
Citation Network
Current paper (gray), citations (green), references (blue)
Display is limited for performance on very large graphs.
Discussion 0