Distributions of Historic Market Data - Stock Returns
Publication
Metrics
AI Quick Summary
This paper demonstrates that historic stock return distributions align well with the Heston model but not with the multiplicative model, which suggests power-law tails. It also finds that the mean realized variance of returns is linearly related to the number of days, determined by the mean variance in mean-reverting stochastic volatility models.
Paper Preview
Abstract
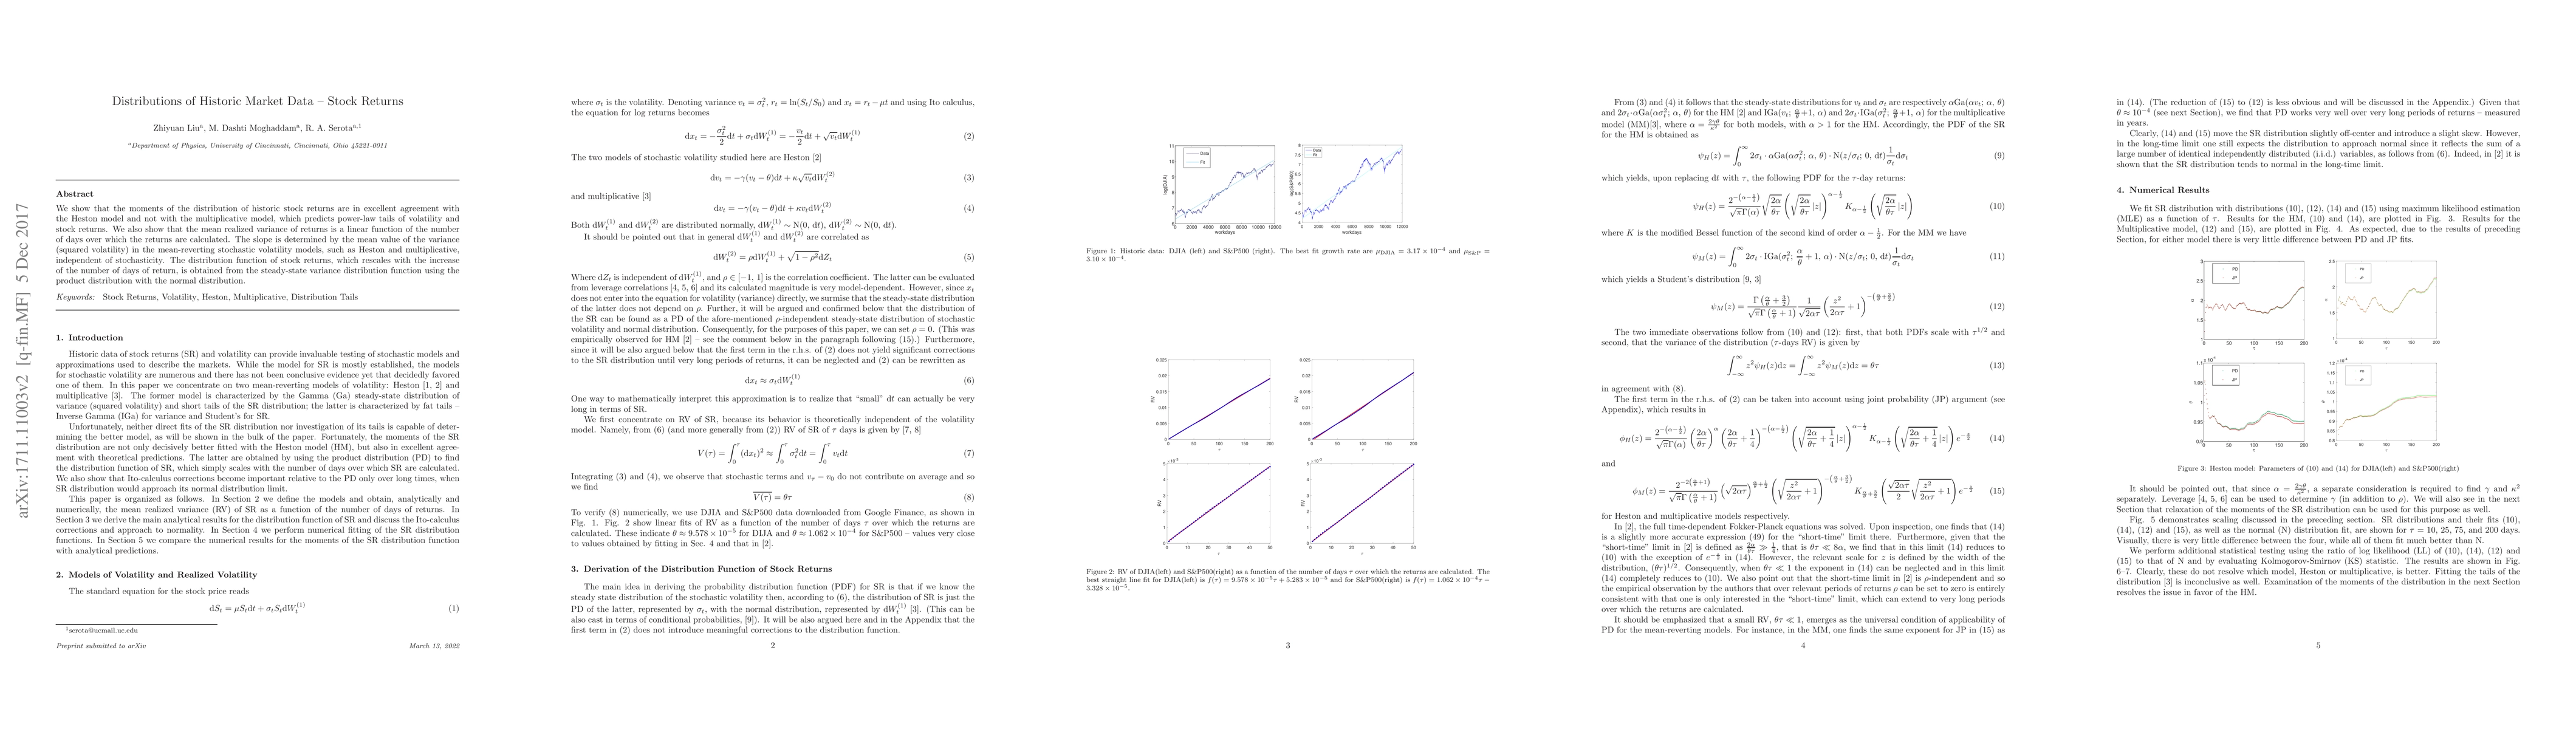
We show that the moments of the distribution of historic stock returns are in excellent agreement with the Heston model and not with the multiplicative model, which predicts power-law tails of volatility and stock returns. We also show that the mean realized variance of returns is a linear function of the number of days over which the returns are calculated. The slope is determined by the mean value of the variance (squared volatility) in the mean-reverting stochastic volatility models, such as Heston and multiplicative, independent of stochasticity. The distribution function of stock returns, which rescales with the increase of the number of days of return, is obtained from the steady-state variance distribution function using the product distribution with the normal distribution.
AI Key Findings
Get AI-generated insights about this paper's methodology, results, significance, and more — seven facets brought into focus.
Impact
Paper Details
PDF Preview
Key Terms
Citation Network
Current paper (gray), citations (green), references (blue)
Display is limited for performance on very large graphs.
Discussion 0