DSPO: An End-to-End Framework for Direct Sorted Portfolio Construction
Publication
Metrics
AI Quick Summary
DSPO is an innovative framework for constructing characteristic-sorted portfolios by processing raw stock data directly, employing neural networks to model stock dependencies and a novel Monotonical Logistic Regression loss for optimization, achieving significant returns and high RankIC scores in empirical tests.
Paper Preview
Abstract
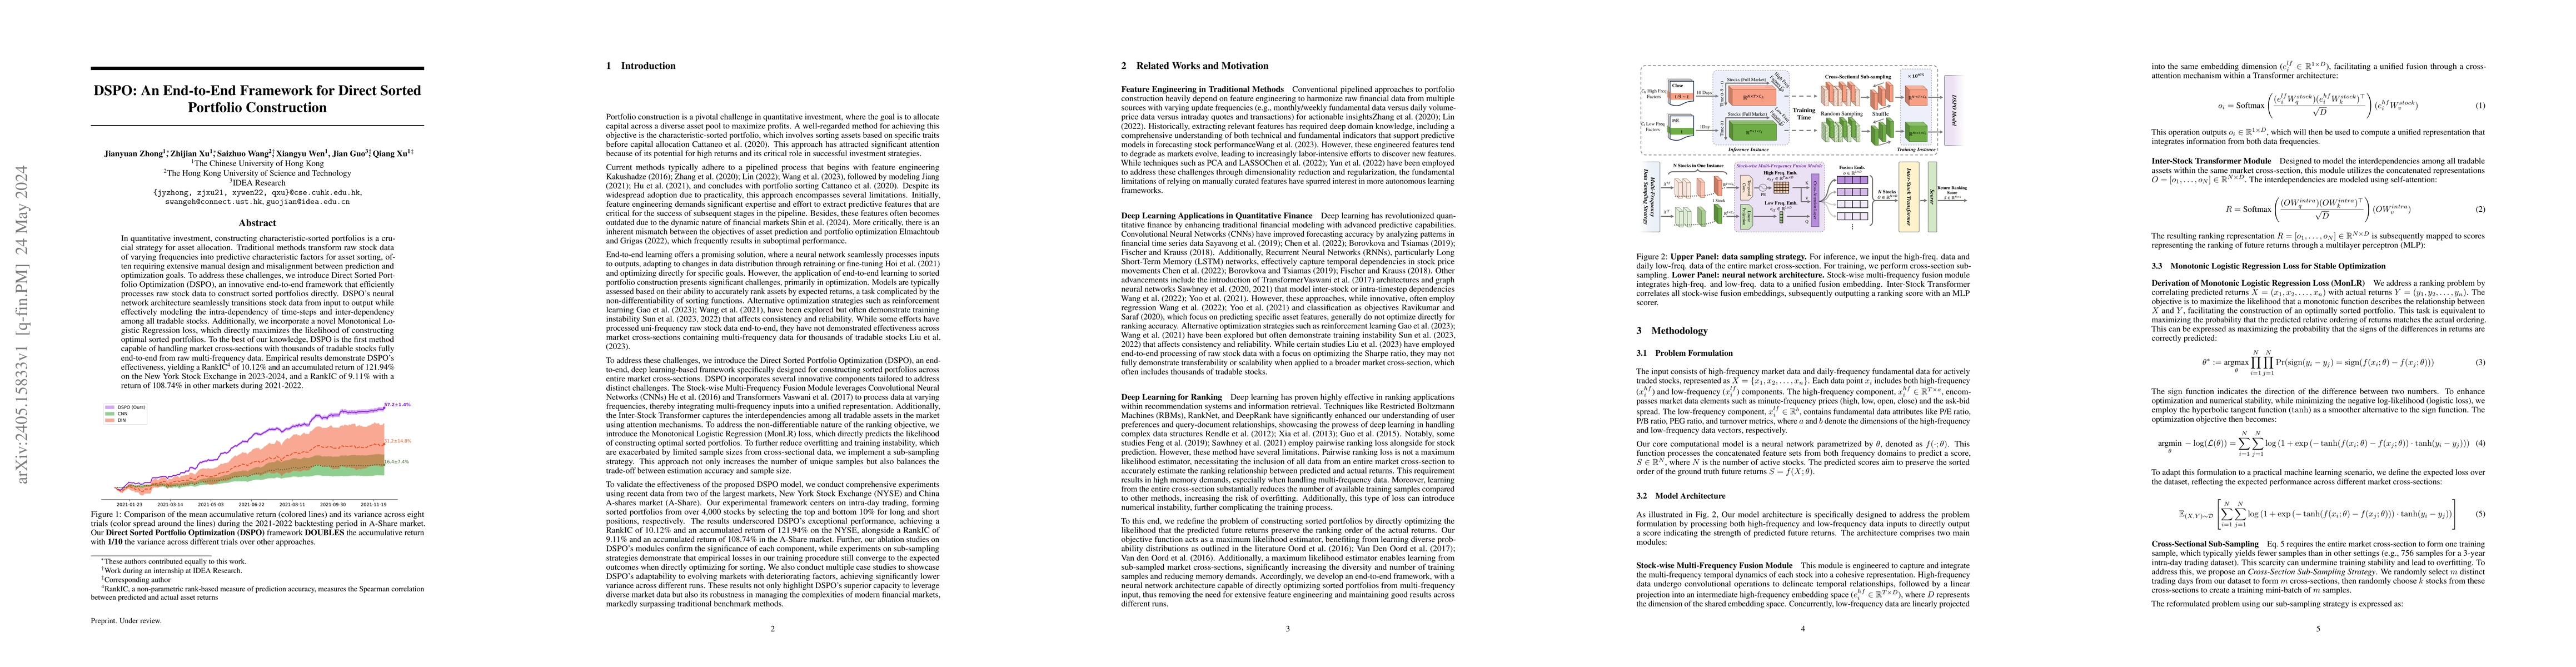
In quantitative investment, constructing characteristic-sorted portfolios is a crucial strategy for asset allocation. Traditional methods transform raw stock data of varying frequencies into predictive characteristic factors for asset sorting, often requiring extensive manual design and misalignment between prediction and optimization goals. To address these challenges, we introduce Direct Sorted Portfolio Optimization (DSPO), an innovative end-to-end framework that efficiently processes raw stock data to construct sorted portfolios directly. DSPO's neural network architecture seamlessly transitions stock data from input to output while effectively modeling the intra-dependency of time-steps and inter-dependency among all tradable stocks. Additionally, we incorporate a novel Monotonical Logistic Regression loss, which directly maximizes the likelihood of constructing optimal sorted portfolios. To the best of our knowledge, DSPO is the first method capable of handling market cross-sections with thousands of tradable stocks fully end-to-end from raw multi-frequency data. Empirical results demonstrate DSPO's effectiveness, yielding a RankIC of 10.12\% and an accumulated return of 121.94\% on the New York Stock Exchange in 2023-2024, and a RankIC of 9.11\% with a return of 108.74\% in other markets during 2021-2022.
AI Key Findings
Get AI-generated insights about this paper's methodology, results, significance, and more — seven facets brought into focus.
Impact
Paper Details
Authors
PDF Preview
Key Terms
Citation Network
Current paper (gray), citations (green), references (blue)
Display is limited for performance on very large graphs.
Discussion 0